

Modeling the emergence of whisker direction maps in rat barrel cortex
- PMID: 20107500
- PMCID: PMC2809738
- DOI: 10.1371/journal.pone.0008778
Modeling the emergence of whisker direction maps in rat barrel cortex
Abstract
Based on measuring responses to rat whiskers as they are mechanically stimulated, one recent study suggests that barrel-related areas in layer 2/3 rat primary somatosensory cortex (S1) contain a pinwheel map of whisker motion directions. Because this map is reminiscent of topographic organization for visual direction in primary visual cortex (V1) of higher mammals, we asked whether the S1 pinwheels could be explained by an input-driven developmental process as is often suggested for V1. We developed a computational model to capture how whisker stimuli are conveyed to supragranular S1, and simulate lateral cortical interactions using an established self-organizing algorithm. Inputs to the model each represent the deflection of a subset of 25 whiskers as they are contacted by a moving stimulus object. The subset of deflected whiskers corresponds with the shape of the stimulus, and the deflection direction corresponds with the movement direction of the stimulus. If these two features of the inputs are correlated during the training of the model, a somatotopically aligned map of direction emerges for each whisker in S1. Predictions of the model that are immediately testable include (1) that somatotopic pinwheel maps of whisker direction exist in adult layer 2/3 barrel cortex for every large whisker on the rat's face, even peripheral whiskers; and (2) in the adult, neurons with similar directional tuning are interconnected by a network of horizontal connections, spanning distances of many whisker representations. We also propose specific experiments for testing the predictions of the model by manipulating patterns of whisker inputs experienced during early development. The results suggest that similar intracortical mechanisms guide the development of primate V1 and rat S1.
Conflict of interest statement
Figures
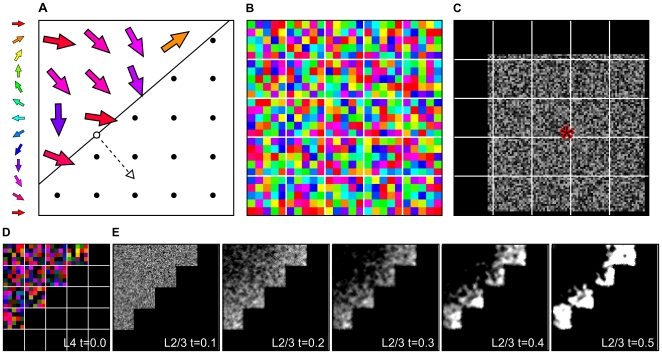
 ). The stimulus is a half plane, which has moved almost half-way through the whisker field in this example. Deflected whiskers are those to the left of the plane. Impinged whiskers are deflected roughly in the direction of stimulus motion, but we apply normally distributed noise to each, with concentration parameter
  in the example. B The L4 sheet is divided into barrels (delineated by white), each containing 25 neurons with pre-assigned MEDs (pixel color) from around the circle, and located arbitrarily within the barrel. C L2/3 is divided into supra-barrels (21
 21 neurons in each), such that each neuron receives weighted projections from all L4 neurons in the corresponding barrel. Each L2/3 neuron also receives fixed excitatory lateral connections from itself and its 8 immediate neighbors (its lateral excitatory connection field). Each also receives inhibitory connections from all neurons that fall within a 4
 4-barrel area (84
 84 neurons) centered on its location; the lateral inhibitory connection field for the neuron marked * is shown. The brightness indicates connection strengths from * to each neuron before training. D The example input is represented in L4 by activating neurons whose MEDs are similar to the direction of deflected whiskers. E Initially random activity in stimulated L2/3 supra-barrels migrates to the leading edge of the stimulus as lateral interactions settle for each of steps
  . All plots are normalized separately.
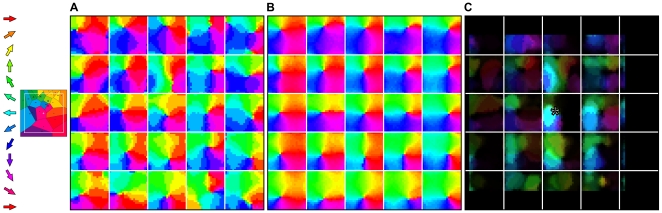
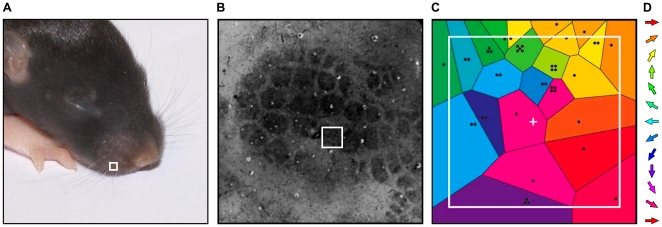
 ). Maps in each supra-barrel are a match to that measured by ref. in which neurons on the left of each supra-barrel, for example, prefer leftward deflections of the PW. Reprinted and adapted by permission from Macmillan Publishers Ltd: Nature Neuroscience , copyright 2006. Supra-barrels are delineated by white lines. B Mean direction preference for neurons at each cortical location, over the 20 networks in the same data set, showing that the organization is consistent across runs. C Plot of the long range lateral connection strengths, from the representative example neuron at the position marked by *, to the rest of the cortical map. Pixel brightness indicates lateral weight strength, and the color indicates the preferred deflection direction of each connected neuron. This neuron becomes most strongly connected to others, some located many supra-barrels away, that are tuned to similar directions of PW deflection.
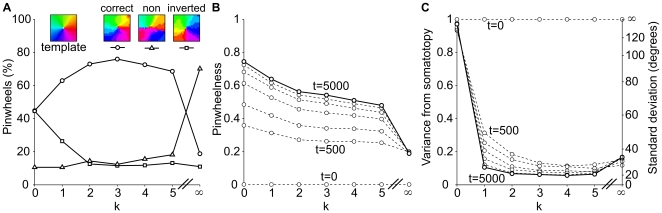
 ), pinwheel maps emerge in each supra-barrel, but they are equally likely to rotate clockwise or counter-clockwise. When such a correlation is present in the inputs (
 ), the number of supra-barrels containing pinwheels that rotate in a somatotopically consistent way increases to a maximum of 76%. Surprisingly, perfectly correlated inputs (
 ) degrade pinwheel quality. B This behavior is reflected in a plot of absolute ‘pinwheelness’ scores, in which all but the scores for
  progress over training iterations (t = 0, 500, 1,000, 2,000, 3,000, 4,000 in progressive dashed lines) toward good scores at t = 5,000 (solid line). Scores are highest for
  , suggesting that networks trade a bias to maximize pinwheelness for one towards somatotopic alignment as
  is increased. C shows that pinwheels rotating in the correct direction become aligned to the somatotopic template, with a final circular standard deviation
  for
for  .
.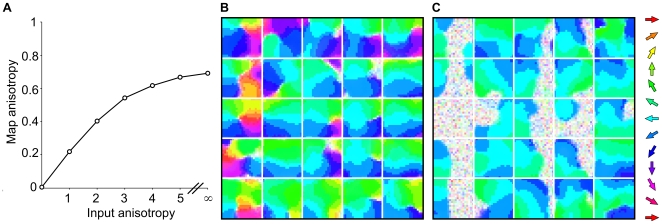
 were drawn from circular normal distributions with varying degrees of concentration (input anisotropy), towards a mean of
  . Results suggest that biased experience to a particular direction of stimulus will cause an over representation of that direction in the supra-barrels. Map anisotropy scores converge to 0.69 (out of a maximum of 1.0) when the networks are trained in a regime where half-plane stimuli always move in the same direction. B shows an example map from a network trained on input anisotropy 3.0, where pixel saturation indicates a lower direction selectivity for each neuron. Distorted pinwheel structures still form in many barrels, but the map is clearly dominated by neurons preferring
  deflection directions. C shows a similar map from a network trained on input anisotropy
  , wherein patches of non-selective neurons form on the right side of the left most supra-barrels where the leading edge of the stimulus is least likely to occur.
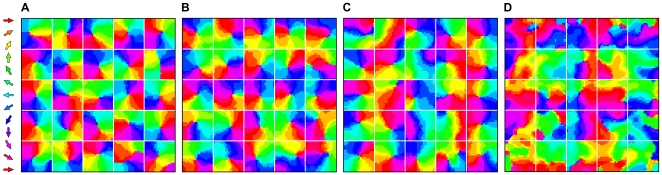
 network, which develops good pinwheels in each supra-barrel but no consistent global organization. B Removing global correlations. Example map measured from a network trained on 5,000 inputs wherein the location of the stimulated whiskers was randomly shuffled on each iteration (
 ). C Direction map measured from one representative network trained on 5,000 inputs wherein the whiskers are deflected in the same combinations as in the normal case, but the mean direction in which they are deflected bears no relation to the stimulus direction implied by this combination (
 ). In both controls, maps resemble V1 orientation or direction maps rather than rodent S1 maps, because they cover all directions continuously on the local scale but have no consistent global alignment. D When whisker deflection directions are perfectly correlated with the whisker combination (
 ), the supra-barrel borders no longer affect the input correlations, and so the map groups similar directions together rather than developing independent pinwheels.
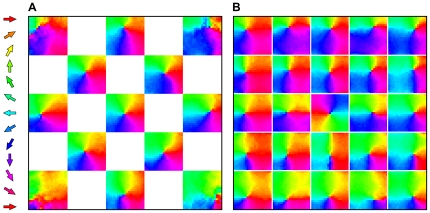
 ) whenever the more caudal whiskers are primarily deflected, during the critical period. Although difficult to perform, this experimental paradigm would be very useful for assessing the time course of map plasticity.
Similar articles
-
Spatial gradients and inhibitory summation in the rat whisker barrel system.J Neurophysiol. 1996 Jul;76(1):130-40. doi: 10.1152/jn.1996.76.1.130. J Neurophysiol. 1996. PMID: 8836214
-
Modelling the emergence of whisker barrels.Elife. 2020 Sep 29;9:e55588. doi: 10.7554/eLife.55588. Elife. 2020. PMID: 32988453 Free PMC article.
-
Layer 4 barrel cortex neurons retain their response properties during whisker replacement.J Neurophysiol. 2018 Nov 1;120(5):2218-2231. doi: 10.1152/jn.00333.2018. Epub 2018 Jul 25. J Neurophysiol. 2018. PMID: 30044148
-
Somatosensory maps.Handb Clin Neurol. 2018;151:73-102. doi: 10.1016/B978-0-444-63622-5.00004-8. Handb Clin Neurol. 2018. PMID: 29519481 Review.
-
Representation of tactile scenes in the rodent barrel cortex.Neuroscience. 2018 Jan 1;368:81-94. doi: 10.1016/j.neuroscience.2017.08.039. Epub 2017 Aug 23. Neuroscience. 2018. PMID: 28843997 Review.
Cited by
-
Late emergence of the vibrissa direction selectivity map in the rat barrel cortex.J Neurosci. 2011 Jul 20;31(29):10689-700. doi: 10.1523/JNEUROSCI.6541-10.2011. J Neurosci. 2011. PMID: 21775612 Free PMC article.
-
Familiarization: A theory of repetition suppression predicts interference between overlapping cortical representations.PLoS One. 2017 Jun 12;12(6):e0179306. doi: 10.1371/journal.pone.0179306. eCollection 2017. PLoS One. 2017. PMID: 28604787 Free PMC article.
-
Time-sensitive reorganization of the somatosensory cortex poststroke depends on interaction between Hebbian and homeoplasticity: a simulation study.J Neurophysiol. 2014 Dec 15;112(12):3240-50. doi: 10.1152/jn.00433.2013. Epub 2014 Oct 1. J Neurophysiol. 2014. PMID: 25274347 Free PMC article.
-
Organization of sensory feature selectivity in the whisker system.Neuroscience. 2018 Jan 1;368:70-80. doi: 10.1016/j.neuroscience.2017.09.014. Epub 2017 Sep 14. Neuroscience. 2018. PMID: 28918260 Free PMC article. Review.
-
Emergence in the central nervous system.Cogn Neurodyn. 2013 Jun;7(3):173-95. doi: 10.1007/s11571-012-9229-6. Epub 2012 Nov 28. Cogn Neurodyn. 2013. PMID: 24427200 Free PMC article.
References
-
- Weliky M, Bosking WH, Fitzpatrick D. A systematic map of direction preference in primary visual cortex. Nature. 1996;379:725–8. - PubMed
-
- Ohki K, Chung S, Kara P, Hübener M, Bonhoeffer T, et al. Highly ordered arrangement of single neurons in orientation pinwheels. Nature. 2006;442:925–928. - PubMed
-
- Li Y, Fitzpatrick D, White LE. The development of direction selectivity in ferret visual cortex requires early visual experience. Nat Neurosci. 2006;9:676–681. - PubMed
-
- White LE, Fitzpatrick D. Vision and cortical map development. Neuron. 2007;56:327–338. - PubMed
-
- Swindale NV. The development of topography in the visual cortex: a review of models. Network: Comput Neural Syst. 1996;7:161–247. - PubMed
