Selective detection of NADPH oxidase in polymorphonuclear cells by means of NAD(P)H-based fluorescence lifetime imaging
- PMID: 20107577
- PMCID: PMC2809359
- DOI: 10.1155/2008/602639
Selective detection of NADPH oxidase in polymorphonuclear cells by means of NAD(P)H-based fluorescence lifetime imaging
Abstract
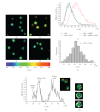
NADPH oxidase (NOX2) is a multisubunit membrane-bound enzyme complex that, upon assembly in activated cells, catalyses the reduction of free oxygen to its superoxide anion, which further leads to reactive oxygen species (ROS) that are toxic to invading pathogens, for example, the fungus Aspergillus fumigatus. Polymorphonuclear cells (PMNs) employ both nonoxidative and oxidative mechanisms to clear this fungus from the lung. The oxidative mechanisms mainly depend on the proper assembly and function of NOX2. We identified for the first time the NAD(P)H-dependent enzymes involved in such oxidative mechanisms by means of biexponential NAD(P)H-fluorescence lifetime imaging (FLIM). A specific fluorescence lifetime of 3670 +/- 140 picoseconds as compared to 1870 picoseconds for NAD(P)H bound to mitochondrial enzymes could be associated with NADPH bound to oxidative enzymes in activated PMNs. Due to its predominance in PMNs and due to the use of selective activators and inhibitors, we strongly believe that this specific lifetime mainly originates from NOX2. Our experiments also revealed the high site specificity of the NOX2 assembly and, thus, of the ROS production as well as the dynamic nature of these phenomena. On the example of NADPH oxidase, we demonstrate the potential of NAD(P)H-based FLIM in selectively investigating enzymes during their cellular function.
Figures


Similar articles
-
Systematic Enzyme Mapping of Cellular Metabolism by Phasor-Analyzed Label-Free NAD(P)H Fluorescence Lifetime Imaging.Int J Mol Sci. 2019 Nov 7;20(22):5565. doi: 10.3390/ijms20225565. Int J Mol Sci. 2019. PMID: 31703416 Free PMC article.
-
Noniterative biexponential fluorescence lifetime imaging in the investigation of cellular metabolism by means of NAD(P)H autofluorescence.Chemphyschem. 2004 Aug 20;5(8):1141-9. doi: 10.1002/cphc.200400066. Chemphyschem. 2004. PMID: 15446736
-
Method to Detect the Cellular Source of Over-Activated NADPH Oxidases Using NAD(P)H Fluorescence Lifetime Imaging.Curr Protoc Cytom. 2017 Apr 3;80:9.52.1-9.52.14. doi: 10.1002/cpcy.20. Curr Protoc Cytom. 2017. PMID: 28369765
-
Neutrophils to the ROScue: Mechanisms of NADPH Oxidase Activation and Bacterial Resistance.Front Cell Infect Microbiol. 2017 Aug 25;7:373. doi: 10.3389/fcimb.2017.00373. eCollection 2017. Front Cell Infect Microbiol. 2017. PMID: 28890882 Free PMC article. Review.
-
NADPH oxidases, reactive oxygen species, and hypertension: clinical implications and therapeutic possibilities.Diabetes Care. 2008 Feb;31 Suppl 2:S170-80. doi: 10.2337/dc08-s247. Diabetes Care. 2008. PMID: 18227481 Review.
Cited by
-
Tracking CNS and systemic sources of oxidative stress during the course of chronic neuroinflammation.Acta Neuropathol. 2015 Dec;130(6):799-814. doi: 10.1007/s00401-015-1497-x. Epub 2015 Oct 31. Acta Neuropathol. 2015. PMID: 26521072 Free PMC article. Clinical Trial.
-
Analyzing Nicotinamide Adenine Dinucleotide Phosphate Oxidase Activation in Aging and Vascular Amyloid Pathology.Front Immunol. 2017 Jul 31;8:844. doi: 10.3389/fimmu.2017.00844. eCollection 2017. Front Immunol. 2017. PMID: 28824611 Free PMC article.
-
Systematic Enzyme Mapping of Cellular Metabolism by Phasor-Analyzed Label-Free NAD(P)H Fluorescence Lifetime Imaging.Int J Mol Sci. 2019 Nov 7;20(22):5565. doi: 10.3390/ijms20225565. Int J Mol Sci. 2019. PMID: 31703416 Free PMC article.
-
In the Right Place, at the Right Time: Spatiotemporal Conditions Determining Plasma Cell Survival and Function.Front Immunol. 2019 Apr 24;10:788. doi: 10.3389/fimmu.2019.00788. eCollection 2019. Front Immunol. 2019. PMID: 31068930 Free PMC article. Review.
-
Immunoglobulin expression in the endoplasmic reticulum shapes the metabolic fitness of B lymphocytes.Life Sci Alliance. 2020 Apr 27;3(6):e202000700. doi: 10.26508/lsa.202000700. Print 2020 Jun. Life Sci Alliance. 2020. PMID: 32341085 Free PMC article.
References
-
- Babior BM. NADPH oxidase: an update. Blood. 1999;93(5):1464–1476. - PubMed
-
- Romani L. Immunity to fungal infections. Nature Reviews Immunology. 2004;4(1):1–23. - PubMed
-
- DeLeo FR, Allen L-AH, Apicella M, Nauseef WM. NADPH oxidase activation and assembly during phagocytosis. The Journal of Immunology. 1999;163(12):6732–6740. - PubMed
-
- Massenet C, Chenavas S, Cohen-Addad C, et al. Effects of p47p h o x C terminus phosphorylations on binding interactions with p40p h o x and p67p h o x: structural and functional comparison of p40p h o x and p67p h o x SH3 domains. The Journal of Biological Chemistry. 2005;280(14):13752–13761. - PubMed
LinkOut - more resources
Full Text Sources
Other Literature Sources
Miscellaneous

