

School board survey of attention deficit/hyperactivity disorder: Prevalence of diagnosis and stimulant medication therapy
- PMID: 20107591
- PMCID: PMC2810669
- DOI: 10.1093/pch/5.1.19
School board survey of attention deficit/hyperactivity disorder: Prevalence of diagnosis and stimulant medication therapy
Abstract
Background: Attention deficit/hyperactivity disorder (ADHD), a well described, common problem affecting school-aged children, has an estimated prevalence in Ontario of 7% to 10% of boys and 3% of girls in the age range of four to 11 years. There has been a documented trend to increased use of stimulant medications in the treatment of this disorder in the United States.
Objective: To assess the prevalence of stimulant medication therapy for ADHD in three southern Ontario school boards.
Patients and methods: A cross-sectional epidemiological study was performed by distributing a survey to all parents of children in kindergarten through grade 6 in six to eight schools selected randomly in each of the three participating school boards. The completed questionnaires were collated, and the comparative data were analyzed using chi(2).
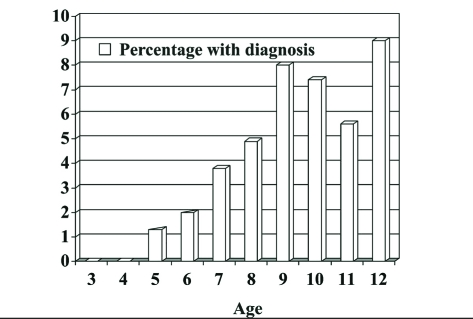
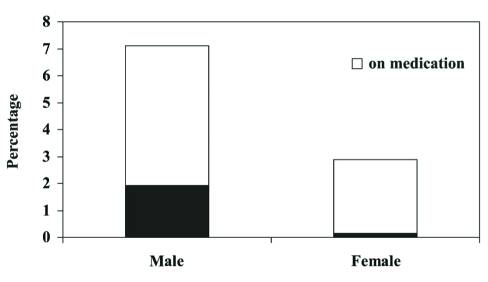
Results: A total of 5100 surveys were distributed among the three school boards; 1465 (28.8%) questionnaires were returned completed. Within the three school boards - Hastings County Board of Education, Metropolitan Toronto Separate School Board and the East York Board of Education - the prevalence of ADHD for the age groups surveyed was 4.3%, 3.4% and 6.8%, respectively (average 4.7%), with a peak average of almost 9% by 12 years of age. The percentages of children with diagnosed ADHD who were on stimulant medication were 43%, 3% and 13%, respectively. The differences between the school boards were statistically significant (P<0.05). The male versus female prevalence of a diagnosis of ADHD was 7.1% versus 1.2%, 3.8% versus 3.3% and 10.1% versus 3.6%, respectively, with a combined school board average of 7.1% of males versus 2.9% of females. The average percentage of males versus females who were diagnosed with ADHD and who were on stimulant medication was found to be 27% versus 5%.
Conclusions: The prevalence of ADHD was 4.7% in the study population. The overall percentage of children who were on stimulant medication was approximately 1%. Males were not only more likely to be diagnosed with ADHD but also more likely to be treated with stimulant medications if diagnosed. There was an increased prevalence of ADHD with older age, and the different school boards had significant differences in both the percentages of children who were diagnosed with ADHD and the percentages of children who were on medication, suggesting that individual school board policies or other factors may affect both the rate of diagnosis and the likelihood of stimulant drug treatment.
HISTORIQUE :: Le trouble d’hyperactivité avec déficit de l’attention (THDA), un problème bien décrit et courant qui touche les enfants d’âge scolaire, présente une prévalence évaluée entre 7 % et 10 % chez les garçons et à 3 % chez les filles de quatre à 11 ans en Ontario. Aux États-Unis, on a documenté une tendance accrue à utiliser des médicaments stimulants pour traiter ce trouble.
OBJECTIF :: Évaluer la prévalence du traitement à l’aide de médicaments stimulants contre le THDA dans trois conseils scolaires du sud de l’Ontario.
MÉTHODOLOGIE :: Une étude épidémiologique transversale a été exécutée par sondage auprès de tous les parents d’enfants de la maternelle à la sixième année dans six à huit écoles choisies au hasard parmi chacun des trois conseils scolaires participants. Les questionnaires remplis ont été colligés, et les données comparatives ont été analysées au moyen de χ2.
RÉSULTATS :: Au total, 5 100 sondages ont été distribués dans les trois conseils scolaires; 1 465 (28,8 %) ont été renvoyés remplis. Dans les trois conseils scolaires, soit le Hastings County Board of Education, le Metropolitan Toronto Separate School Board et le East York Board of Education, la prévalence de THDA au sein des groupes d’âge sondés était de 4,3 %, 3,4 % et 6,8 %, respectivement (moyenne de 4,7 %), la moyenne de crête s’établissant à près de 9 % à l’âge de 12 ans. Le pourcentage d’enfants au THDA diagnostiqué qui prenaient des médicaments stimulants était de 43 %, 3 % et 13 %, respectivement. Les différences entre les conseils scolaires étaient significatives du point de vue statistique (P<0,05). La prévalence de diagnostic de THDA entre les garçons et les filles était de 7,1 % par rapport à 1,2 %, de 3,8 % par rapport à 3,3% et de 10,1 % par rapport à 3,6 %, respectivement, la moyenne combinée des conseils scolaires correspondant à 7,1 % de garçons par rapport à 2,9 % de filles. Le pourcentage moyen de garçons par rapport aux filles qui avaient reçu un diagnostic de THDA et qui prenaient des médicaments stimulants était de 27 % par rapport à 5 % de filles.
CONCLUSIONS :: La prévalence de THDA était de 4,7 % dans la population à l’étude. Le pourcentage global d’enfants qui prenaient des médicaments stimulants était de 1 % environ. Les garçons étaient non seulement plus susceptibles de recevoir un diagnostic de THDA, mais également de prendre des médicaments stimulants après un tel diagnostic. La prévalence de THDA était plus élevée chez les enfants plus âgés, et les divers conseils scolaires présentaient des différences marquées tant pour ce qui est du pourcentage d’enfants ayant reçu un diagnostic de THDA que pour celui d’enfants qui prenaient des médicaments, ce qui laisse supposer que les politiques de chaque conseil scolaire ou que d’autres facteurs influencent peut-être à la fois le taux de diagnostic et la vraisemblance d’utilisation à l’aide de médicaments stimulants.
Keywords: Attention deficit/hyperactivity disorder; Stimulant medications; Stimulant treatment.
Figures
Similar articles
-
Diagnosis and treatment of attention-deficit/hyperactivity disorder in children and adolescents. Council on Scientific Affairs, American Medical Association.JAMA. 1998 Apr 8;279(14):1100-7. doi: 10.1001/jama.279.14.1100. JAMA. 1998. PMID: 9546570 Review.
-
Prevalence of prescribed attention-deficit hyperactivity disorder medications and diagnosis among Canadian preschoolers and school-age children: 1994-2007.Can J Psychiatry. 2012 Feb;57(2):93-101. doi: 10.1177/070674371205700206. Can J Psychiatry. 2012. PMID: 22340149
-
Mental health in the United States. Prevalence of diagnosis and medication treatment for attention-deficit/hyperactivity disorder--United States, 2003.MMWR Morb Mortal Wkly Rep. 2005 Sep 2;54(34):842-7. MMWR Morb Mortal Wkly Rep. 2005. PMID: 16138075
-
Age of Onset, Duration, and Type of Medication Therapy for Attention-Deficit/Hyperactivity Disorder and Substance Use During Adolescence: A Multi-Cohort National Study.J Am Acad Child Adolesc Psychiatry. 2016 Jun;55(6):479-86. doi: 10.1016/j.jaac.2016.03.011. Epub 2016 Apr 7. J Am Acad Child Adolesc Psychiatry. 2016. PMID: 27238066 Free PMC article.
-
Preschool attention deficit hyperactivity disorder: a review of prevalence, diagnosis, neurobiology, and stimulant treatment.J Dev Behav Pediatr. 2002 Feb;23(1 Suppl):S1-9. doi: 10.1097/00004703-200202001-00002. J Dev Behav Pediatr. 2002. PMID: 11875284 Review.
Cited by
-
Life in the last lane.Paediatr Child Health. 2002 Dec;7(10):681-8. Paediatr Child Health. 2002. PMID: 20046449 Free PMC article. No abstract available.
-
The efficacy of neurofeedback in the management of children with attention deficit/hyperactivity disorder.Paediatr Child Health. 2001 Sep;6(7):451-5. doi: 10.1093/pch/6.7.451. Paediatr Child Health. 2001. PMID: 20107553 Free PMC article.
-
Prescription of methylphenidate to children and youth, 1990-1996.CMAJ. 2001 Nov 27;165(11):1489-94. CMAJ. 2001. PMID: 11762572 Free PMC article.
-
Road trauma in teenage male youth with childhood disruptive behavior disorders: a population based analysis.PLoS Med. 2010 Nov 16;7(11):e1000369. doi: 10.1371/journal.pmed.1000369. PLoS Med. 2010. PMID: 21125017 Free PMC article.
References
-
- Offord DR, Boyle MH, Szatmari P, et al. Ontario Child Health Study. II. Six-month prevalence of disorder and rates of service utilization. Arch Gen Psychiatry. 1987;44:832–6. - PubMed
-
- Boyle MH, Offord DR, Hofmann HG, et al. Ontario Child Health Study. I. Methodology. Arch Gen Psychiatry. 1987;44:826–31. - PubMed
-
- Stevenson RP, Wolraich ML. Stimulant medication therapy in the treatment of children with attention deficit hyperactivity disorder. Pediatr Clin North Am. 1989;36:1183–97. - PubMed
-
- American Psychiatric Association Staff . Diagnostic & Statistical Manual of Mental Disorders: DSM-IV. Washington: American Psychiatric Association; 1994. pp. 78–85.
-
- Safer DJ, Krager JM. Trends in medication treatment of hyperactive school children. Results of six biannual surveys. Clin Pediatr (Phila) 1983;22:500–4. - PubMed
LinkOut - more resources
Full Text Sources