. 2010 Jan 22;6(1):e1000731.
doi: 10.1371/journal.ppat.1000731.

Persistent ER stress induces the spliced leader RNA silencing pathway (SLS), leading to programmed cell death in Trypanosoma brucei

Affiliations

Persistent ER stress induces the spliced leader RNA silencing pathway (SLS), leading to programmed cell death in Trypanosoma brucei

Hanoch Goldshmidt et al. PLoS Pathog. .

Abstract

Trypanosomes are parasites that cycle between the insect host (procyclic form) and mammalian host (bloodstream form). These parasites lack conventional transcription regulation, including factors that induce the unfolded protein response (UPR). However, they possess a stress response mechanism, the spliced leader RNA silencing (SLS) pathway. SLS elicits shut-off of spliced leader RNA (SL RNA) transcription by perturbing the binding of the transcription factor tSNAP42 to its cognate promoter, thus eliminating trans-splicing of all mRNAs. Induction of endoplasmic reticulum (ER) stress in procyclic trypanosomes elicits changes in the transcriptome similar to those induced by conventional UPR found in other eukaryotes. The mechanism of up-regulation under ER stress is dependent on differential stabilization of mRNAs. The transcriptome changes are accompanied by ER dilation and elevation in the ER chaperone, BiP. Prolonged ER stress induces SLS pathway. RNAi silencing of SEC63, a factor that participates in protein translocation across the ER membrane, or SEC61, the translocation channel, also induces SLS. Silencing of these genes or prolonged ER stress led to programmed cell death (PCD), evident by exposure of phosphatidyl serine, DNA laddering, increase in reactive oxygen species (ROS) production, increase in cytoplasmic Ca(2+), and decrease in mitochondrial membrane potential, as well as typical morphological changes observed by transmission electron microscopy (TEM). ER stress response is also induced in the bloodstream form and if the stress persists it leads to SLS. We propose that prolonged ER stress induces SLS, which serves as a unique death pathway, replacing the conventional caspase-mediated PCD observed in higher eukaryotes.


Conflict of interest statement

The authors have declared that no competing interests exist.

Figures

Figure 1
Figure 1. Transcriptome changes in T. brucei treated with DTT resemble analogous changes in other eukaryotes.
A. Heat map of genes that are differentially regulated in cells treated with 4 mM DTT for 1 or 3 hrs relative to untreated cells. Transcripts that differ from the control by >1.5-fold change were chosen for the analysis. Each column represents the average of three biological replicates. The heat map was generated using the average linkage hierarchical clustering algorithm and Euclidean distance as a similarity measure. The diagram represents the differential expression level according to the following color scale: red- up-regulated genes; green- down-regulated genes. B. Scatter plot analysis showing correlation of the transcriptome data from trypanosomes treated with 4 mM DTT for 1 or 3 hours. C. Pie diagram of up-regulated genes during UPR in four organisms (Table S3), compared to the response in T. brucei (Table S2). Data were obtained for the following organisms. S. cerevisiae ; C. elegans: ; D. melanogaster ; H. sapiens: (see Table S3).
Figure 2
Figure 2. ER-stress response regulates the half-life of mRNAs.
A. Northern analysis of mRNA levels. Untreated cells or cells treated with 4 mM DTT for 1.5 hours were treated with sinefungin (2 µg/ml) and, after 10 min, with actinomycin D (30 µg/ml). RNA was prepared at the time points indicated above the lanes, separated on a 1.2% agarose–formaldehyde gel, and subjected to Northern analysis with the indicated gene-specific probes. 7SL RNA was used to control for equal loading. i, chaperone protein DNAJ; ii, protein disulfide isomerase; iii, thioredoxin; iv, syntaxin. B. Half life of the different mRNAs in untreated versus DTT-treated cells. The hybridization signals were measured by densitometry. The level of the mRNAs of i, chaperone protein DNAJ; ii, protein disulfide isomerase; iii, thioredoxin; iv, syntaxin; in the different time points is illustrated by blue diamonds (untreated) and by red squares (DTT treatment). The half-life is indicated by the broken lines.
Figure 3
Figure 3. ER stressors induce BiP expression and ER dilation.
A. Western blot analysis of BiP protein. Whole cell extracts (106 cells/lane) were prepared from procyclic (i-ii) or bloodstream trypanosomes (iii) treated with ER stressors for different time points. The extracts were separated on a 10% SDS-polyacrylamide gel and subjected to Western blot analysis using anti-BiP antibodies. hnRNPD0 was used to control loading. i. 4 mM DTT; ii. 20 mM 2-deoxy-D-glucose (2-DG); iii. 4 mM DTT. B. Electron micrographs. i. untreated cells; ii. cells treated with 4 mM DTT for 1 hour. The black arrow indicates the expanded ER. N, nucleus; M, mitochondria; ER, endoplasmic reticulum. Scale bars, 1 µm.
Figure 4
Figure 4. Cell death and induction of SLS by ER stressors.
A. Recovery of cells after DTT treatment. Cells were treated with 4 mM DTT for 0, 30, 60, 120 and 240 minutes, washed twice in PBS and suspended in growth media to the same concentration. Cell growth was monitored for 4 days. Symbols indicate the duration of DTT treatment. B. Northern blot analysis of RNA from cells treated with ER stressors. RNA (10 µg) was prepared from procyclic (1–2) or bloodstream trypanosomes (3) treated with i. 4 mM DTT; ii. 20 mM 2-deoxy-D-glucose for 0, 60, 120 or 240 minutes or iii. 4 mM DTT for 0, 180, 240 minutes and was subjected to Northern analysis with radio-labeled anti-sense RNA probe. The srRNA-1 or srRNA-2 probes were used for loading control. C. Immunofluorescence monitoring the changes in amount and localization of tSNAP42 upon treatment with ER stressors. Cells were treated with i. 4 mM DTT; ii. 20 mM 2-DG for 3 hours. The cells were fixed with 4% (v/v) formaldehyde for 25 min, incubated with tSNAP42 antibodies and detected as described in Materials and Methods. The nucleus was stained with DAPI. DIC- differential interference contrast. The localization of tSNAP42 is indicated with arrows. Scale bars. 5 µm. Enlargement of the nuclear area is framed.
Figure 5
Figure 5. Silencing of SEC61 and SEC63 induces SLS.
A. Northern blot analysis of SEC63 and SEC61 RNAs. RNA was prepared from uninduced (-Tet) and silenced cells 3 days after induction (+Tet) and subjected to Northern analysis with radio-labeled probes. i. Small RNAs; ii. mRNAs. The transcripts examined are indicated. B. Immunofluorescence monitoring the changes in amount and localization of tSNAP42 during SEC63 silencing. Uninduced cells (-Tet) and cells induced (+Tet) for 48 hours were fixed with 4% (v/v) formaldehyde for 25 min, incubated with tSNAP42 antibodies and detected as described in Materials and Methods. The nucleus was stained with DAPI. DIC- differential interference contrast. The localization of tSNAP42 is indicated with arrows. Scale bars, 5 µm. Framed region shows enlargement of the nuclear area. C. Changes in the level of tSNAP42 in cells carrying SEC63 silencing construct. Western blot analysis using anti-tSNAP42 antibodies. Nuclei were extracted from uninduced cells (-Tet) and cells induced (+Tet) for 48 hours, as previously described . The extracts were separated on 10% SDS-PAGE and reacted with anti tSNAP42 antibodies. Rabbit anti PTB1 antiserum was used as a loading control. D. Northern blot analysis of RNA from bloodstream trypanosomes silenced for SEC63. RNA was prepared from uninduced (-Tet) and silenced cells 3 days after induction (+Tet) and subjected to Northern analysis with radio-labeled probes. srRNA-2 probe was used for loading control.
Figure 6
Figure 6. SLS elicits DNA fragmentation.
A. TUNEL assay in SRα silenced cells. TUNEL assay and FACS analysis were performed as described in Materials and Methods. Cells after 3 days of induction without addition of terminal deoxynucleotidyl transferase was used as a negative control. ii. Uninduced cells treated for 10 min with 3000 units/ml of micrococcal nuclease before labeling, used as a positive control. iii. Uninduced cells (-Tet). iv-vi. SRα silenced cells for 2, 3 or 4 days (+Tet), respectively. The green line indicates fluorescence level of cells harboring undamaged DNA. Red line indicates the fluorescence level of cells carrying damaged DNA. B. Analysis of DNA fragmentation by propidium iodide staining and flow cytometry. Uninduced cells (-Tet) or SRα cells silenced for 2, 3 or 4 days (+Tet) were fixed with 100% ethanol for 12 hours at 4°C, washed with PBS and stained for 0.5 hour with 25 µg/ml propidium iodide in the presence of 1 µg/ml RNaseA. DNA content was measured by FACS. The percentage of sub-G1 cells (M1) is indicated. C. Analysis of DNA fragmentation by propidium iodide staining and flow cytometry. The graph represents measurements of sub-G1 population from SRα, SEC61 and SEC63 cells, uninduced (-Tet) or silenced for 3 days(+Tet). The data are derived from three independent experiments and the S.D is indicated. D. DNA laddering during SRα silencing. DNA was isolated from uninduced cells or cells silenced for 2, 3 or 4 days (+Tet) as described in Materials and Methods. DNA (10 µg) was separated on a 1% agarose gel and the gel was stained with ethidium bromide. M - 100bp DNA ladder.
Figure 7
Figure 7. Phosphatidylserine exposure during SLS induction.
A. Diagram showing the different cell populations detected by staining with AnnexinV and PI. B. Analysis of exposed phosphatidylserine on outer membrane of SLS induced cells. Uninduced cells (-Tet) or cells silenced for 2 and 3 days (+Tet), and cells treated with DTT for 0, 4 12, 20 and 24 hours were reacted with fluorescein isothiocyanate-labeled AnnexinV antibodies (MBL©) and stained with propidium iodide according to the manufacturer's instructions. The cells were analyzed by FACS. The panels represent i. SRα silenced cells; ii. SEC61 silenced cells; iii. SEC63 silenced cells; iv. DTT treated cells. C. AnnexinV - PI staining of SLS induced cells. SRα cells were silenced for 3 days (+Tet). Uninduced and silenced cells were stained with AnnexinV and PI, fixed with 4% formaldehyde and visualized. The exposed phosphatidylserine in propidium iodide negative cells are marked by a white arrow.
Figure 8
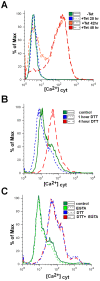
Figure 8. Cytoplasmic calcium concentration is elevated in SLS induced cells.
A. Uninduced cells or SEC63 cells silenced for 20, 42 or 48 hours were treated with 1 µM Fluo-4-AM as described in Materials and Methods. The cells were then analyzed by FACS. B. Calcium increase upon DTT treatment. Cytoplasmic calcium was measured in cells treated with DTT for 0, 1 or 4 hours as described in Panel A. C. Calcium increase upon DTT treatment in calcium-free medium. Cytoplasmic calcium was measured in cells untreated or treated with DTT in medium lacking or containing 1 mM EGTA. Cells were treated with DTT for 4 hours. The symbols indicate the different treatments.
Figure 9
Figure 9. ΔΨm depolarization and ROS formation during SLS.
A. Measurements of mitochondrial outer membrane potential. Cells were harvested and loaded with 150 nM Tetramethyl rhodamine methyl-ester (TMRM) in serum free medium. The samples were incubated in the dark for 15 min at 27°C and then analyzed by FACS. i. Cells uninduced (control) and silenced cell [72 hours (SRα) or 48 hours (SEC63, SEC61)] (+Tet) ii. Cells treated with 4 mM DTT for 0 to 5 hours. The data represent the percentage of cells lacking mitochondria membrane potential obtained from three independent experiments and the S.D. is indicated. B. Measurements of reactive oxygen species formation. Cells were harvested and incubated at 27°C for 30 min with 10 µM DCFH-DA. The cells were washed once with PBS and analyzed by FACS. i. Uninduced cells (control) and silenced cells [72 hours (SRα) or 48 hours (SEC63, SEC61)] (+Tet). ii. Cells treated with 4 mM DTT for 0 to 5 hours. The data represent the average of three independent experiments and the S.D is indicated.
Figure 10
Figure 10. TEM of SLS-induced cells demonstrating morphological changes characteristic of apoptosis.
A. Electron micrographs of untreated cells (i-iv), SEC63 cells after 48 hours of silencing (v-x), and cells treated with 4 mM DTT for 5 hours (xi-xiv) or 12 hours (xv-xvii); (xiii-xiv) sections were immunostained with anti BiP antibodies. N, nucleus; Nuc, nucleolus; M, mitochondria; ER, endoplasmic reticulum; AP, autophagosomes; fp, flagellar pocket. Scale bars: 1 µm. In each panel, the relevant structure is indicated with an arrow (as described in the text). B. Autophagosome formation under SEC63 silencing or DTT treatment. Cells carrying the silencing construct of SEC63 as well as the tagged YFP-ATG8 construct or parental cells carrying YFP-ATG8 constructs were visualized by live imaging using fluorescence microscopy. Parental cells were either i. uninduced (-Tet) or induced for 48 hrs (+Tet); ii. Untreated cells (control) or cells treated with DTT for 4 hrs (DTT), DIC- differential interference contrast. Scale bars, 5 µm.

Similar articles

Cited by

References

    1. Malhotra JD, Kaufman RJ. The endoplasmic reticulum and the unfolded protein response. Semin Cell Dev Biol. 2007;18:716–731. - PMC - PubMed
    1. Vembar SS, Brodsky JL. One step at a time: endoplasmic reticulum-associated degradation. Nat Rev Mol Cell Biol. 2008;9:944–957. - PMC - PubMed
    1. Travers KJ, Patil CK, Wodicka L, Lockhart DJ, Weissman JS, et al. Functional and genomic analyses reveal an essential coordination between the unfolded protein response and ER-associated degradation. Cell. 2000;101:249–258. - PubMed
    1. Ron D, Walter P. Signal integration in the endoplasmic reticulum unfolded protein response. Nat Rev Mol Cell Biol. 2007;8:519–529. - PubMed
    1. Bernales S, Papa FR, Walter P. Intracellular signaling by the unfolded protein response. Annu Rev Cell Dev Biol. 2006;22:487–508. - PubMed

Publication types

MeSH terms