

doi: 10.1039/b823389f.
Imaging gold nanorods in excised human breast carcinoma by spectroscopic optical coherence tomography
Affiliations
- PMID: 20107616
- PMCID: PMC2811328
- DOI: 10.1039/b823389f
Item in Clipboard
Imaging gold nanorods in excised human breast carcinoma by spectroscopic optical coherence tomography
J Mater Chem.
.
Abstract
Plasmon-resonant gold nanorods (GNRs) can serve as imaging agents for spectroscopic optical coherence tomography (SOCT). The aspect ratio of the GNRs are adjusted for maximum absorption in the far red to create a partial spectral overlap with the low-wavelength edge of the near-infrared SOCT imaging band. The spectroscopic absorption profile of the GNRs is incorporated into a depth-resolved algorithm for mapping the relative GNR density within OCT images. This technique enables us to image GNR distributions in excised human breast carcinomas, demonstrating their potential as OCT contrast agents in heteregeneous, highly scattering tissues.
Figures
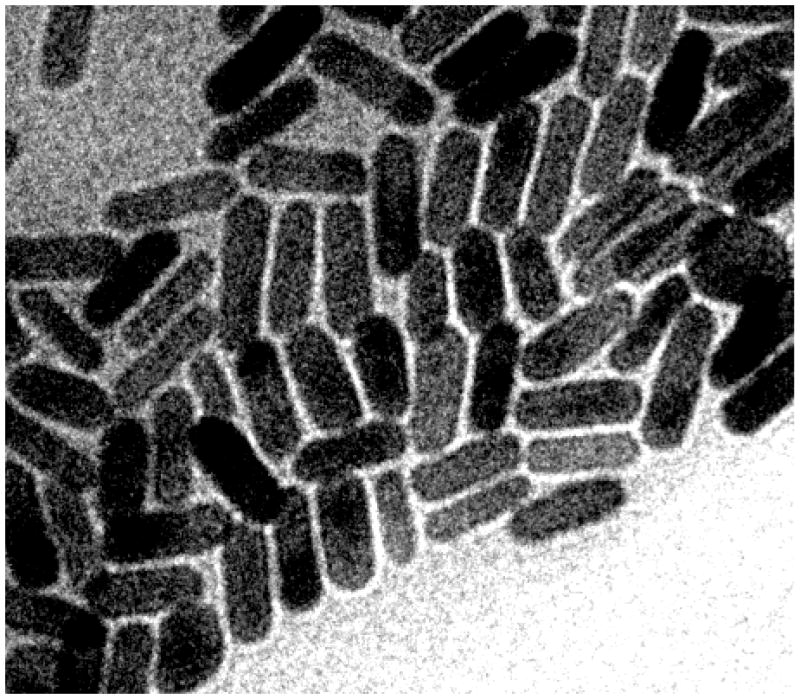
TEM image (Philips CM-200, 120 keV) of GNRs, ca. 15 × 45 nm. Image dimensions: 250 nm × 200 nm.
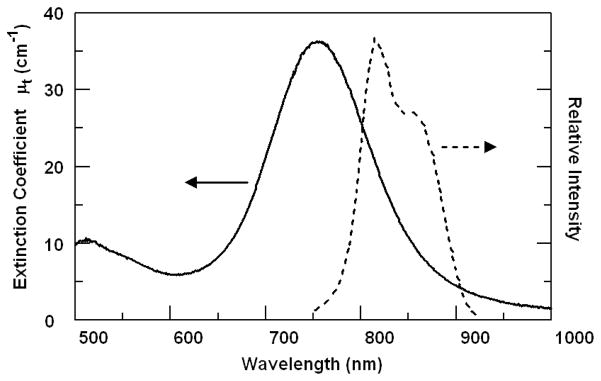
Extinction spectrum (Ocean Optics, USB2000) of GNRs (left, solid curve) and relative intensity of OCT imaging light (right, dotted curve). The GNR absorption peak asymmetrically attenuates the OCT imaging beam, allowing more sensitive detection in SOCT.
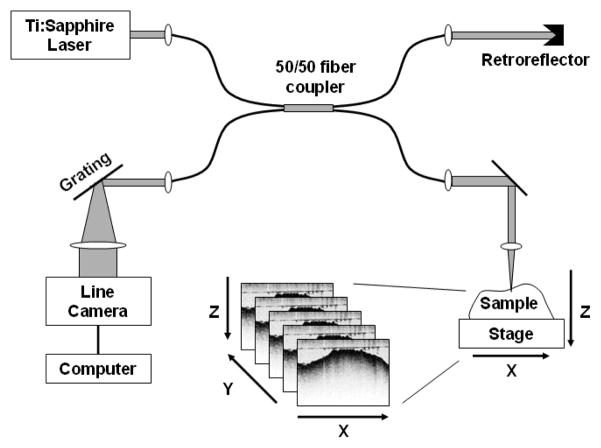
SOCT setup consisting of a single-mode fiber interferometer which splits the light equally (50/50) into the reference and sample arms. The sample is scanned along the x axis during OCT imaging to produce a single B-mode (x-z) image; volumetric image stacks are acquired by displacing the sample in y between successive B-mode scans.
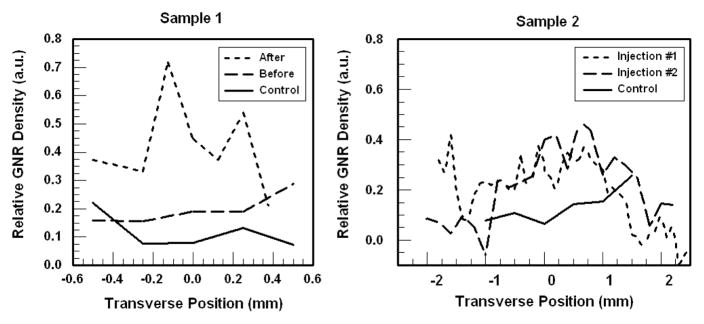
Plots of SOCT image-averaged relative GNR densities in human breast tumors, before or after injection. In each sample, the control group of images was used as the a priori data. The image stacks for Sample 1 (left) display an increase in ρ after GNR injection, whereas the sample before injection is similar to control. Sample 2 (right) exhibits a broad peak in ρ near y=0 after GNR injections, which is consistent with the GNR injection site. GNR density values are relative to that used during the spectral calibration.
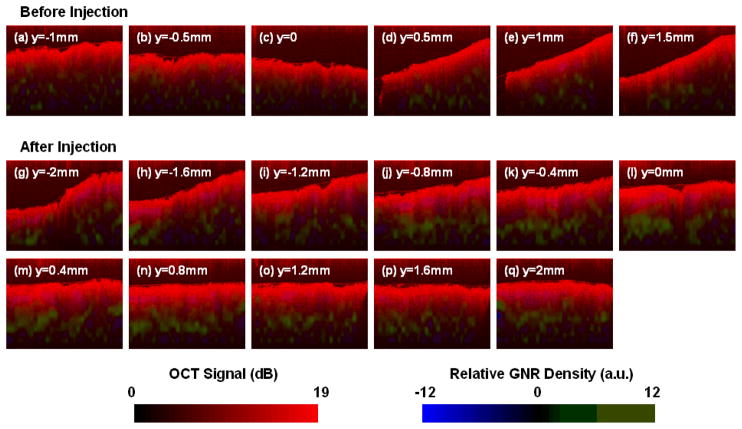
GNR contrast-enhanced SOCT images of a human breast carcinoma tissue sample. (a)–(f) Series of B-mode images before injection, sampled every 0.5 mm along y; (g)–(q) images after the second injection of GNR solution in Sample 2 (cf. Fig. 4), taken from the image stack every 0.4 mm along y. The structural OCT image is presented in red, and the SOCT-computed GNR density is presented in green (ρ>0) or blue (ρ<0). The tissue sample after GNR injection displays a strong and positive increase in ρ compared with the control. Image dimensions: 3 mm × 1 mm.
References
-
- Boppart SA, Oldenburg AL, Xu C, Marks DL. J Biomed Opt. 2005;10:041208-1–14. - PubMed
-
- Morgner U, Drexler W, Fartner FX, Li XD, Pitris C, Ippen EP, Fujimoto JG. Opt Lett. 2000;25:111. - PubMed
-
- Xu C, Carney PS, Boppart SA. Opt Express. 2005;13:5450. - PubMed
-
- Schmitt JM, Xiang SH, Yung KM. J Opt Soc Am A. 1998;15:2288.
Grants and funding
LinkOut - more resources
Full Text Sources
Other Literature Sources