

Atlas-based segmentation of developing tissues in the human brain with quantitative validation in young fetuses
- PMID: 20108226
- PMCID: PMC3306251
- DOI: 10.1002/hbm.20935
Atlas-based segmentation of developing tissues in the human brain with quantitative validation in young fetuses
Abstract
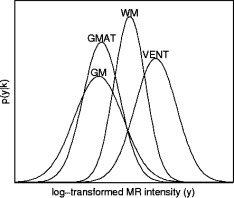
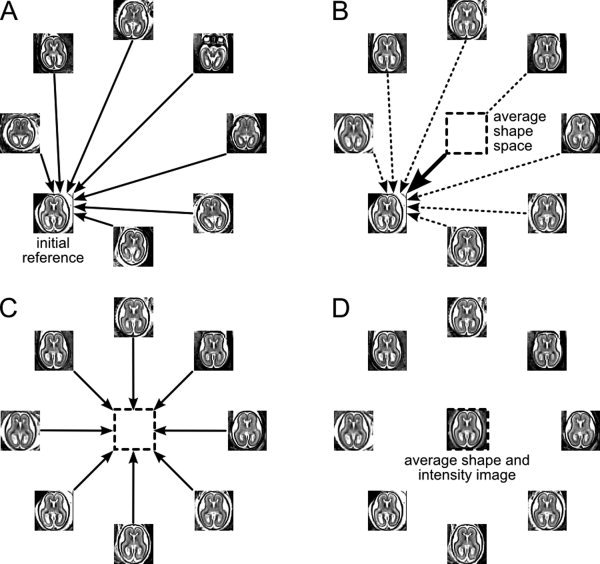
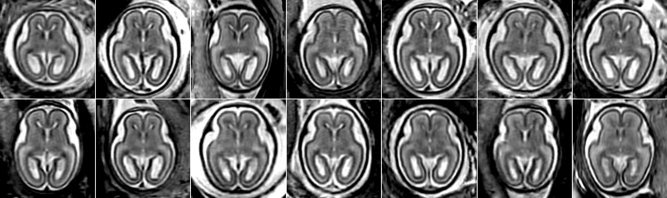
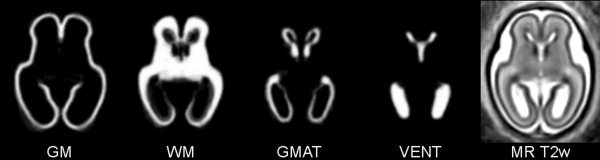
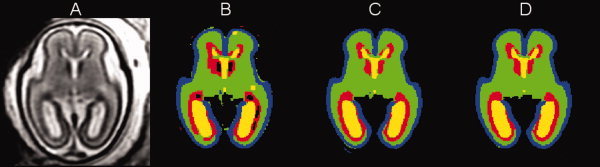
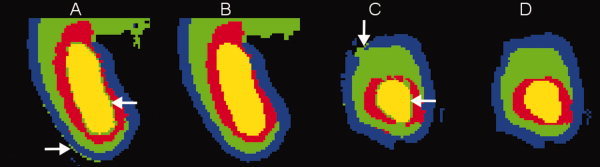
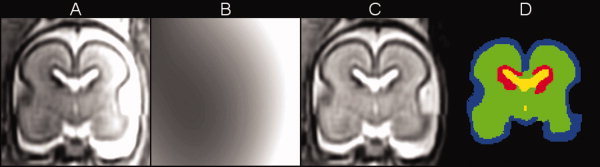
Imaging of the human fetus using magnetic resonance (MR) is an essential tool for quantitative studies of normal as well as abnormal brain development in utero. However, because of fundamental differences in tissue types, tissue properties and tissue distribution between the fetal and adult brain, automated tissue segmentation techniques developed for adult brain anatomy are unsuitable for this data. In this paper, we describe methodology for automatic atlas-based segmentation of individual tissue types in motion-corrected 3D volumes reconstructed from clinical MR scans of the fetal brain. To generate anatomically correct automatic segmentations, we create a set of accurate manual delineations and build an in utero 3D statistical atlas of tissue distribution incorporating developing gray and white matter as well as transient tissue types such as the germinal matrix. The probabilistic atlas is associated with an unbiased average shape and intensity template for registration of new subject images to the space of the atlas. Quantitative whole brain 3D validation of tissue labeling performed on a set of 14 fetal MR scans (20.57-22.86 weeks gestational age) demonstrates that this atlas-based EM segmentation approach achieves consistently high DSC performance for the main tissue types in the fetal brain. This work indicates that reliable measures of brain development can be automatically derived from clinical MR imaging and opens up possibility of further 3D volumetric and morphometric studies with multiple fetal subjects.
Hum Brain Mapp, 2010. © 2010 Wiley-Liss, Inc.
Figures


Similar articles
-
A normative spatiotemporal MRI atlas of the fetal brain for automatic segmentation and analysis of early brain growth.Sci Rep. 2017 Mar 28;7(1):476. doi: 10.1038/s41598-017-00525-w. Sci Rep. 2017. PMID: 28352082 Free PMC article.
-
A spatiotemporal atlas of MR intensity, tissue probability and shape of the fetal brain with application to segmentation.Neuroimage. 2010 Nov 1;53(2):460-70. doi: 10.1016/j.neuroimage.2010.06.054. Epub 2010 Jun 30. Neuroimage. 2010. PMID: 20600970 Free PMC article.
-
Atlas-based segmentation of the germinal matrix from in utero clinical MRI of the fetal brain.Med Image Comput Comput Assist Interv. 2008;11(Pt 1):351-8. doi: 10.1007/978-3-540-85988-8_42. Med Image Comput Comput Assist Interv. 2008. PMID: 18979766 Free PMC article.
-
Fetal brain growth portrayed by a spatiotemporal diffusion tensor MRI atlas computed from in utero images.Neuroimage. 2019 Jan 15;185:593-608. doi: 10.1016/j.neuroimage.2018.08.030. Epub 2018 Aug 30. Neuroimage. 2019. PMID: 30172006 Free PMC article. Review.
-
A review of atlas-based segmentation for magnetic resonance brain images.Comput Methods Programs Biomed. 2011 Dec;104(3):e158-77. doi: 10.1016/j.cmpb.2011.07.015. Epub 2011 Aug 25. Comput Methods Programs Biomed. 2011. PMID: 21871688 Review.
Cited by
-
Early folding patterns and asymmetries of the normal human brain detected from in utero MRI.Cereb Cortex. 2012 Jan;22(1):13-25. doi: 10.1093/cercor/bhr053. Epub 2011 May 12. Cereb Cortex. 2012. PMID: 21571694 Free PMC article.
-
Quantitative and Qualitative Analysis of Transient Fetal Compartments during Prenatal Human Brain Development.Front Neuroanat. 2016 Feb 24;10:11. doi: 10.3389/fnana.2016.00011. eCollection 2016. Front Neuroanat. 2016. PMID: 26941612 Free PMC article.
-
A normative spatiotemporal MRI atlas of the fetal brain for automatic segmentation and analysis of early brain growth.Sci Rep. 2017 Mar 28;7(1):476. doi: 10.1038/s41598-017-00525-w. Sci Rep. 2017. PMID: 28352082 Free PMC article.
-
Growth trajectories of the human fetal brain tissues estimated from 3D reconstructed in utero MRI.Int J Dev Neurosci. 2011 Aug;29(5):529-36. doi: 10.1016/j.ijdevneu.2011.04.001. Epub 2011 Apr 17. Int J Dev Neurosci. 2011. PMID: 21530634 Free PMC article.
-
Cerebrospinal Fluid and Parenchymal Brain Development and Growth in the Healthy Fetus.Dev Neurosci. 2016;38(6):420-429. doi: 10.1159/000456711. Epub 2017 Mar 18. Dev Neurosci. 2016. PMID: 28315866 Free PMC article.
References
-
- Bach Cuadra M, Cammoun L, Butz T, Cuisenaire O, Thiran J‐P ( 2005): Comparison and validation of tissue modelization and statistical classification methods in T1‐weighted MR brain images. IEEE Trans Med Imaging 24: 1548–1565. - PubMed
-
- Battin MR, Maalouf EF, Counsell SJ, Herlihy AH, Rutherford MA, Azzopardi D, Edwards AD ( 1998): Magnetic resonance imaging of the brain in very preterm infants: Visualization of the germinal matrix, early myelination, and cortical folding. Pediatrics 101: 957–962. - PubMed
-
- Brugger PC, Stuhr F, Lindner C, Prayer D ( 2006): Methods of fetal MR: Beyond T2‐weighted imaging. Eur J Radiol 57: 172–181. - PubMed
-
- Chandramohan D, Habas PA, Kim K, Glenn OA, Barkovich AJ, Studholme C ( 2009): Cortical thickness mapping of the human fetal brain in utero from motion‐corrected clinical MRI: Preliminary results. 15th Annual Meeting of the Organization for Human Brain Mapping, doi: 10.1016/S1053‐8119(09)70081‐3.
-
- Claude I, Daire J‐L, Sebag G ( 2004): Fetal brain MRI: Segmentation and biometric analysis of the posterior fossa. IEEE Trans Biomed Eng 51: 617–626. - PubMed
Publication types
MeSH terms
Grants and funding
LinkOut - more resources
Full Text Sources
