. 2010 Apr 1;109(5):1033-44.
doi: 10.1002/jcb.22486.

Improved myocardial perfusion in chronic diabetic mice by the up-regulation of pLKB1 and AMPK signaling

Affiliations

Improved myocardial perfusion in chronic diabetic mice by the up-regulation of pLKB1 and AMPK signaling

Claudia Kusmic et al. J Cell Biochem. .

Abstract

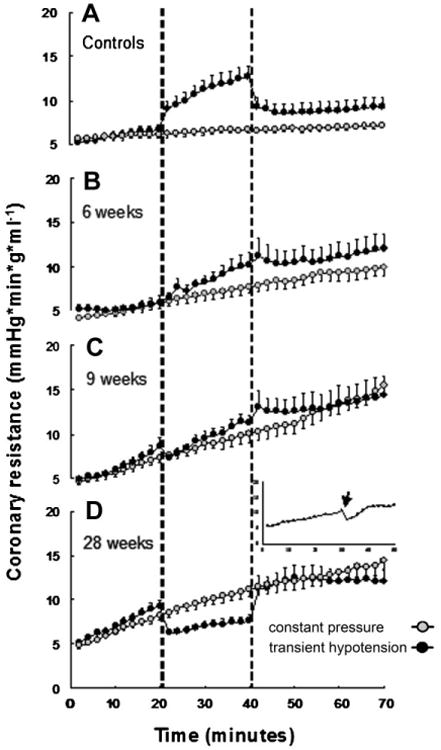
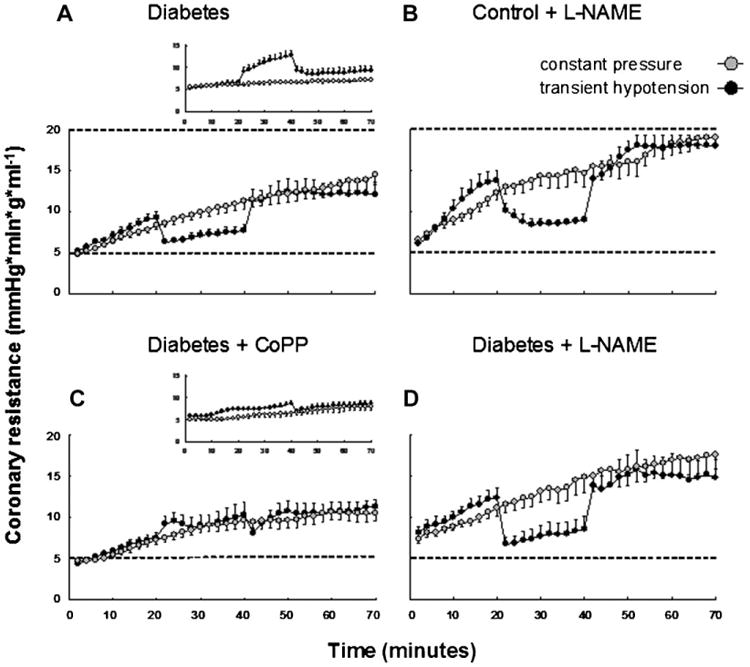
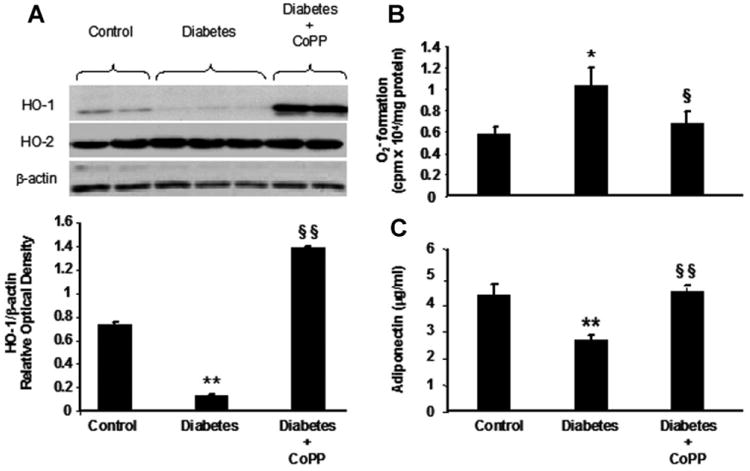
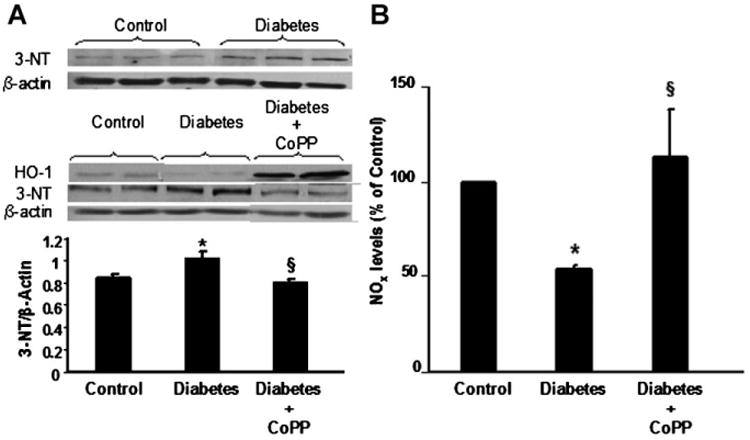
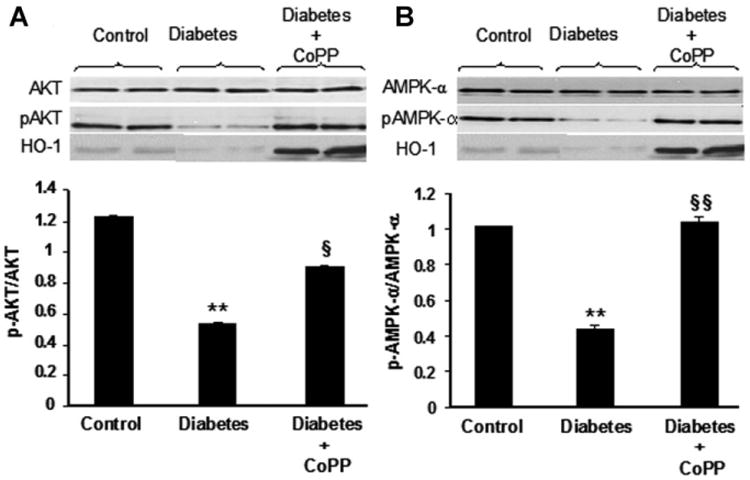
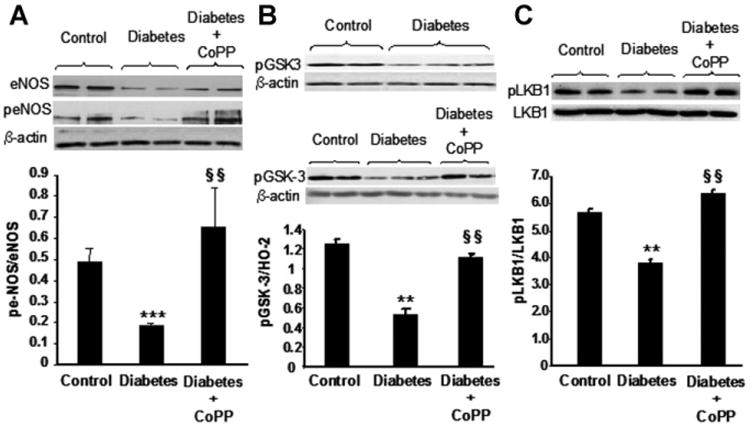
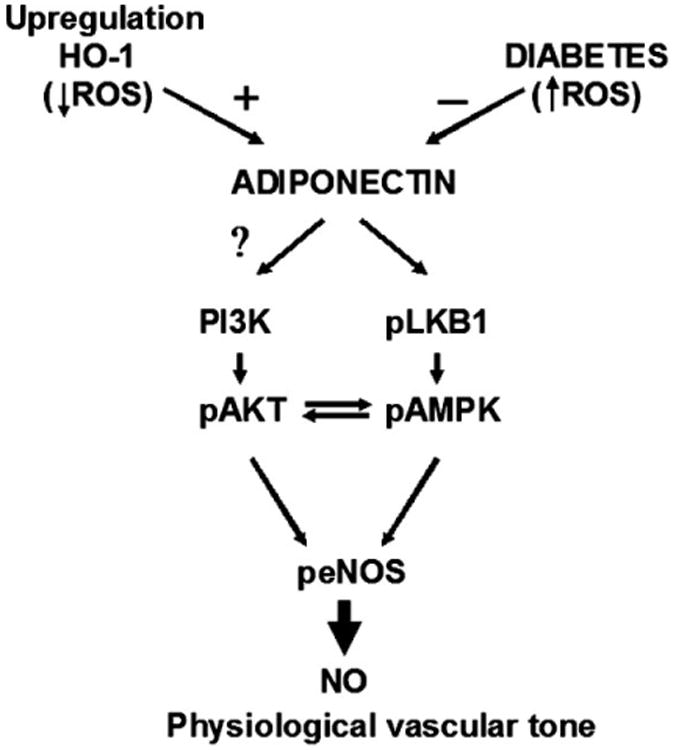
Previous studies related impaired myocardial microcirculation in diabetes to oxidative stress and endothelial dysfunction. Thus, this study was aimed to determine the effect of up-regulating pAMPK-pAKT signaling on coronary microvascular reactivity in the isolated heart of diabetic mice. We measured coronary resistance in wild-type and streptozotocin (STZ)-treated mice, during perfusion pressure changes. Glucose, insulin, and adiponectin levels in plasma and superoxide formation, NOx levels and heme oxygenase (HO) activity in myocardial tissue were determined. In addition, the expression of HO-1, 3-nitrotyrosine, pLKB1, pAMPK, pAKT, and peNOS proteins in control and diabetic hearts were measured. Coronary response to changes in perfusion pressure diverged from control in a time-dependent manner following STZ administration. The responses observed at 28 weeks of diabetes (the maximum time examined) were mimicked by L-NAME administration to control animals and were associated with a decrease in serum adiponectin and myocardial pLKB1, pAMPK, pAKT, and pGSK-3 expression. Cobalt protoporphyrin treatment to induce HO-1 expression reversed the microvascular reactivity seen in diabetes towards that of controls. Up-regulation of HO-1 was associated with an increase in adiponectin, pLKB1, pAKT, pAMPK, pGSK-3, and peNOS levels and a decrease in myocardial superoxide and 3-nitrotyrosine levels. In the present study we describe the time course of microvascular functional changes during the development of diabetes and the existence of a unique relationship between the levels of serum adiponectin, pLKB1, pAKT, and pAMPK activation in diabetic hearts. The restoration of microvascular function suggests a new therapeutic approach to even advanced cardiac microvascular derangement in diabetes.


Figures

Fig. 1
Fig. 1
Coronary microvascular resistance in protocol 1 (perfusion at 65 mmHg constant pressure), gray circles, as compared to protocol 2 (transient 30 mmHg perfusion pressure), black circles, in controls and in diabetic animals at 6, 9, and 28 weeks following STZ or vehicle administration. Dashed vertical lines mark the period of low pressure in protocol 2. A: Control group (gray n = 11 and black n = 9). Controls have been pooled together as no differences were apparent at 6, 9, and 28 weeks. B: Six-week diabetic mice (gray n = 6 and black n = 5). C: Nine-week diabetic mice (gray n = 5 and black n = 6). D: Twenty-eight-week diabetic mice (gray n =11 and black n =10). Inset shows the effect of administration in bolus (arrow) of papaverine in 28-week diabetic mouse during protocol 1 (constant pressure perfusion).
Fig. 2
Fig. 2
Coronary microvascular resistance in protocol 1 (perfusion at 65 mmHg constant pressure, gray circles) as compared to protocol 2 (transient 30 mmHg perfusion pressure, black circles). Dashed horizontal lines are set at 5 and 20 marks on the coronary resistance axis for a better comparison between panels. A: Twenty-eight-week diabetic mice (gray n = 11 and black n = 10) already shown in Figure 1A. Inset reproduces the response in control group (gray n = 11 and black n = 9) for comparison. B: The addition of the NOS synthase inhibitor L-NAME in controls (gray n = 6 and black n =6). C: The effect of CoPP treatment in diabetic mice (gray n = 6 and black n = 7). Inset reproduces the effect of CoPP treatment in controls (gray n = 6 and black n = 9) for comparison. D: The addition of L-NAME to diabetic mice (gray n = 6 and black n = 6).
Fig. 3
Fig. 3
A: Western blot and densitometry analysis of HO-1, HO-2 and β-actin expression in myocardium of control and diabetic mice untreated or treated with CoPP. **P< 0.01 diabetes versus control, §§P<0.01 diabetes CoPP versus diabetes. Histograms are mean ±SE, n = 4 in each group. B: Myocardial O2 production in control, diabetic mice, and diabetic mice treated with CoPP. *P< 0.05 diabetes versus control; §P<0.05 diabetes CoPP versus diabetes. Results are mean ±SE; n =4 in each group. C: Serum adiponectin levels in control and diabetic mice, untreated and treated with CoPP. Serum samples were obtained immediately prior to sacrifice. **P<0.01 diabetes versus control; §§P< 0.01 diabetes CoPP versus diabetes. Results are mean ±SE, n = 4 in each group.
Fig. 4
Fig. 4
A: Western blot analysis showing 3-nitrotyrosine (3-NT), β-actin and HO-1 expression in hearts of control, diabetic mice untreated or treated with CoPP. Quantitative densitometry is expressed as ratio between 3-NT and the comparative protein β-actin. *P<0.05 diabetes versus control; §P<0.05 diabetes CoPP versus untreated diabetes. Results are expressed as mean ±SE, n = 5 in each group. B: Overall nitrates and nitrites (NOx) levels in heart tissues obtained from control and diabetic mice untreated or treated with CoPP. Results are means ±SE, n = 3 and they are expressed as percent of control (0.49 ±0.09 μmol/L). *P< 0.05 diabetes versus control and §P<0.05 diabetes CoPP versus diabetes.
Fig. 5
Fig. 5
Western blot of total and phosphorylated (p−) forms of AKT (panel A), and AMPK (panel B) expression in hearts of control, diabetic mice untreated or treated with CoPP. Western blot bands of HO-1 are shown as control for CoPP efficacy in HO-1 over-expression. Quantitative densitometry for each enzyme is expressed as ratio between phosphorylated and total amount of protein. **P<0.01 diabetes versus control, §P< 0.05 and §§P<0.01 diabetes CoPP versus diabetes. Each bar represents mean ±SE of four experiments.
Fig. 6
Fig. 6
A: Western blot of total and phorphorylated (p−) forms of eNOS expression in hearts of control, diabetic mice untreated or treated with CoPP. Myocardial β-actin expression (comparative protein) is shown. Quantitative densitometry is expressed as ratio between phosphorylated and total amount of protein. ***P< 0.001 diabetes versus control, §§P<0.01 diabetes CoPP versus diabetes. Each bar represents mean ±SE of four experiments. B: pGSK-3(Ser 9) and β-actin expression in myocardium of control and diabetic mice untreated or treated with CoPP. Quantitative densitometry was determined. **P<0.01 diabetes versus control, §§P<0.01 diabetes CoPP versus diabetes. Each bar represents mean ± SE of four experiments in control and CoPP-treated diabetic mice and mean±SE of six experiments in diabetic group. C: Western blot of total and phosphorylated form of LKB1 in myocardium isolated from control, diabetic, and CoPP-treated diabetic mice. Quantitative densitometry is expressed as ratio between phosphorylated and total amount of protein. **P<0.01 diabetes versus control, §§P<0.01 diabetes CoPP versus diabetes. Each column represents mean ± SE of four experiments.
Fig. 7
Fig. 7
Hypothetical adiponectin-based mechanisms for coronary vasculature control. The scheme postulates the operation of adiponectin influence on LBK1-AMPK and PI3K/AKT pathways being negatively regulated by diabetic condition (increased ROS) and positively regulated by HO-1 expression.

References

    1. Abraham NG, Kappas A. Pharmacological and clinical aspects of heme oxygenase. Pharmacol Rev. 2008;60:79–127. - PubMed
    1. Abraham NG, Kushida T, McClung J, Weiss M, Quan S, Lafaro R, Darzynkiewicz Z, Wolin M. Heme oxygenase-1 attenuates glucose-mediated cell growth arrest and apoptosis in human microvessel endothelial cells. Circ Res. 2003;93:507–514. - PubMed
    1. Al-Khalili L, Krook A, Zierath JR, Cartee GD. Prior serum- and AICAR-induced AMPK activation in primary human myocytes does not lead to subsequent increase in insulin-stimulated glucose uptake. Am J Physiol Endocrinol Metab. 2004;287:E553–E557. - PubMed
    1. Berg AH, Scherer PE. Adipose tissue, inflammation, and cardiovascular disease. Circ Res. 2005;96:939–949. - PubMed
    1. Berg AH, Combs TP, Du X, Brownlee M, Scherer PE. The adipocyte-secreted protein Acrp30 enhances hepatic insulin action. Nat Med. 2001;7:947–953. - PubMed

Publication types

MeSH terms

LinkOut - more resources