

Initial testing of the aurora kinase A inhibitor MLN8237 by the Pediatric Preclinical Testing Program (PPTP)
- PMID: 20108338
- PMCID: PMC2874079
- DOI: 10.1002/pbc.22430
Initial testing of the aurora kinase A inhibitor MLN8237 by the Pediatric Preclinical Testing Program (PPTP)
Abstract
Background: MLN8237 is a small molecule inhibitor of Aurora Kinase A (AURKA) that is currently in early phase clinical testing. AURKA plays a pivotal role in centrosome maturation and spindle formation during mitosis.
Procedures: MLN8237 was tested against the Pediatric Preclinical Testing Program (PPTP) in vitro panel at concentrations ranging from 1.0 nM to 10 microM and was tested against the PPTP in vivo panels at a dose of 20 mg/kg administered orally twice daily x 5 days. Treatment duration was 6 weeks for solid tumor xenografts and 3 weeks for ALL xenografts.
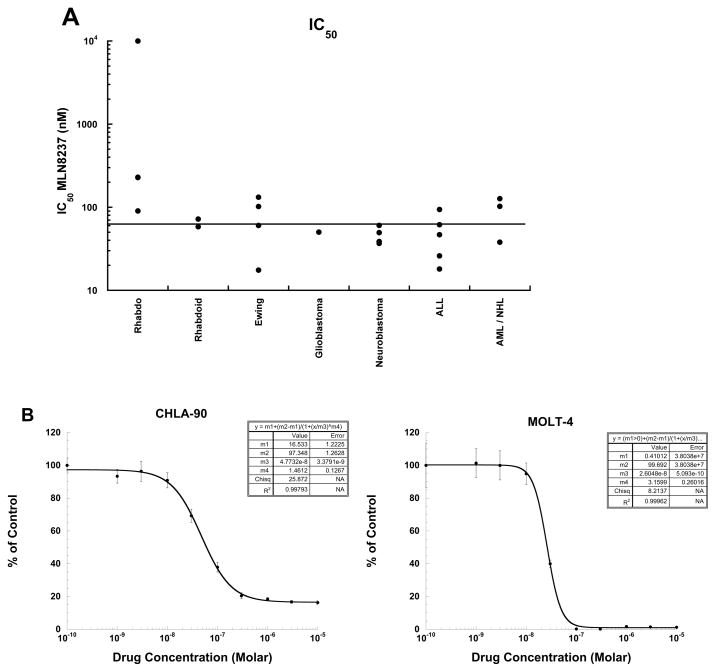
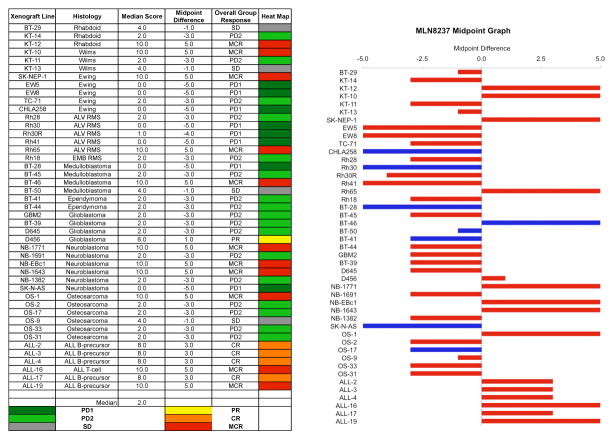
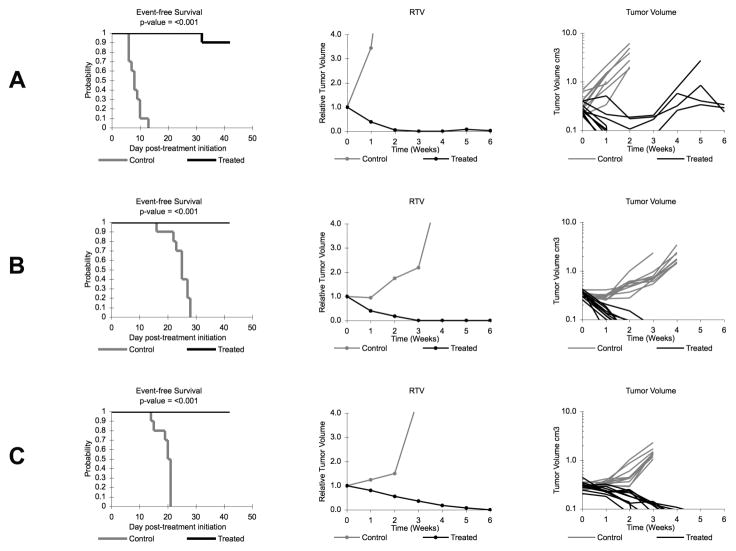
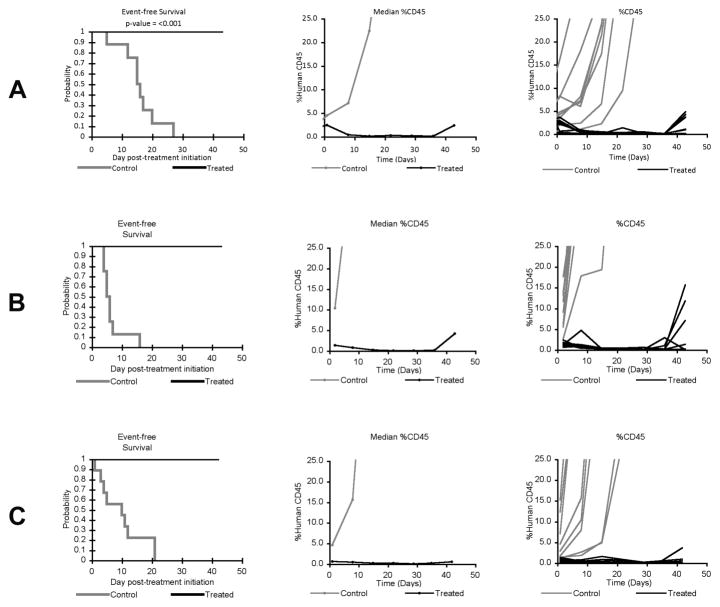
Results: MLN8237 had a median IC(50) of 61 nM against the PPTP in vitro panel. The ALL cell lines were more sensitive and the rhabdomyosarcoma cell lines less sensitive than the remaining PPTP cell lines. In vivo, MLN8237 induced significant differences in event-free survival (EFS) distributions compared to controls in 32/40 (80%) solid tumor models and all (6/6) ALL models. Maintained complete responses (CRs) were observed in 3 of 7 neuroblastoma xenografts, and all 6 evaluable ALL xenografts achieved CR (n = 4) or maintained CR (n = 2) status. Maintained CRs were observed among single xenografts in other panels, including the Wilms tumor, rhabdoid tumor, rhabdomyosarcoma, Ewing sarcoma, osteosarcoma, and medulloblastoma.
Conclusions: The in vivo activity observed against the neuroblastoma panel far exceeds that observed for standard agents evaluated against the panel by the PPTP. High levels of in vivo activity were also observed against the ALL xenograft panel. These data support expedited clinical development of MLN8237 in childhood cancer.
Conflict of interest statement
Conflict of interest statement: The authors consider that there are no actual or perceived conflicts of interest.
Figures
Comment in
-
AURKA inhibitors: right in time.Pediatr Blood Cancer. 2010 Jul 15;55(1):3-4. doi: 10.1002/pbc.22548. Pediatr Blood Cancer. 2010. PMID: 20486161 No abstract available.
References
-
- Jackson JR, Patrick DR, Dar MM, et al. Targeted anti-mitotic therapies: can we improve on tubulin agents? Nature reviews. 2007;7(2):107–117. - PubMed
-
- Vijapurkar U, Wang W, Herbst R. Potentiation of kinesin spindle protein inhibitor-induced cell death by modulation of mitochondrial and death receptor apoptotic pathways. Cancer research. 2007;67(1):237–245. - PubMed
-
- Garuti L, Roberti M, Bottegoni G. Small molecule aurora kinases inhibitors. Curr Med Chem. 2009;16(16):1949–1963. - PubMed
-
- Warner SL, Gray PJ, Von Hoff DD. Tubulin-associated drug targets: Aurora kinases, Polo-like kinases, and others. Seminars in oncology. 2006;33(4):436–448. - PubMed
Publication types
MeSH terms
Substances
Grants and funding
LinkOut - more resources
Full Text Sources
Other Literature Sources
Miscellaneous
