

Substrate catalysis enhances single-enzyme diffusion
- PMID: 20108965
- PMCID: PMC2832858
- DOI: 10.1021/ja908773a
Substrate catalysis enhances single-enzyme diffusion
Abstract
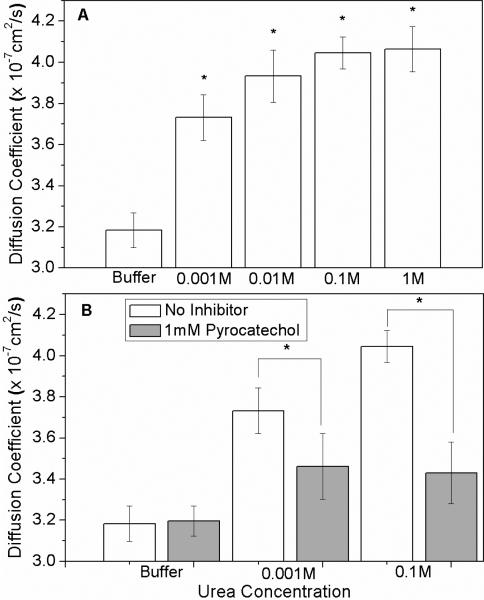
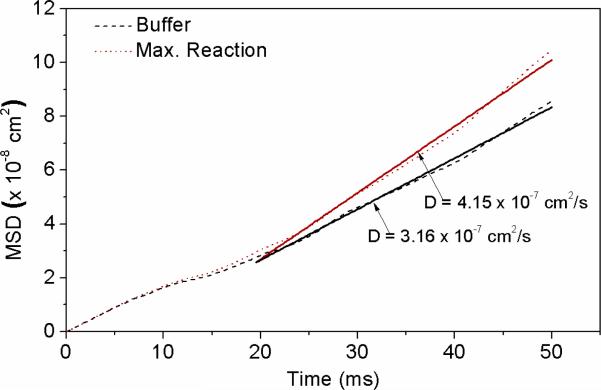
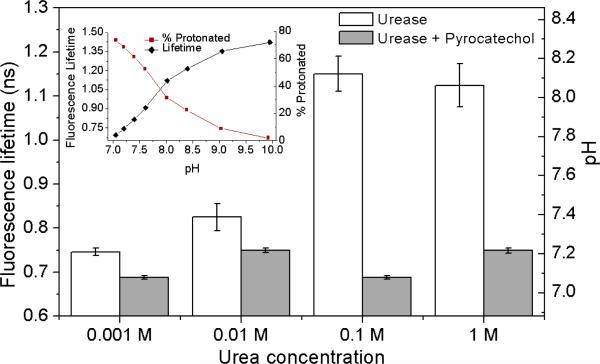
We show that diffusion of single urease enzyme molecules increases in the presence of urea in a concentration-dependent manner and calculate the force responsible for this increase. Urease diffusion measured using fluorescence correlation spectroscopy increased by 16-28% over buffer controls at urea concentrations ranging from 0.001 to 1 M. This increase was significantly attenuated when urease was inhibited with pyrocatechol, demonstrating that the increase in diffusion was the result of enzyme catalysis of urea. Local molecular pH changes as measured using the pH-dependent fluorescence lifetime of SNARF-1 conjugated to urease were not sufficient to explain the increase in diffusion. Thus, a force generated by self-electrophoresis remains the most plausible explanation. This force, evaluated using Brownian dynamics simulations, was 12 pN per reaction turnover. These measurements demonstrate force generation by a single enzyme molecule and lay the foundation for a further understanding of biological force generation and the development of enzyme-driven nanomotors.
Figures
References
-
-
Reviews: Paxton W, Sundararajan S, Mallouk T, Sen A. Angew. Chem. Int. Ed. 2006;45:5420–5429.Wang J. ACS Nano. 2009;3:4–9.Sanchez S, Pumera M. Chem. Asian J. 2009;4:1402–1430.
-
-
- Golestanian R. Phy. Rev. Lett. 2009;102(14):188305. - PubMed
-
- Lakowicz JR. Principles of fluorescence spectroscopy. Springer; New York: 2006.
-
-
Supporting information.
-
Publication types
MeSH terms
Substances
Grants and funding
LinkOut - more resources
Full Text Sources
