. 2010 Jul;12(7):939-61.
doi: 10.1111/j.1462-5822.2010.01443.x. Epub 2010 Jan 26.

Coordinated loading of IRG resistance GTPases on to the Toxoplasma gondii parasitophorous vacuole

Affiliations
Free PMC article

Coordinated loading of IRG resistance GTPases on to the Toxoplasma gondii parasitophorous vacuole

Aliaksandr Khaminets et al. Cell Microbiol. 2010 Jul.
Free PMC article

Abstract

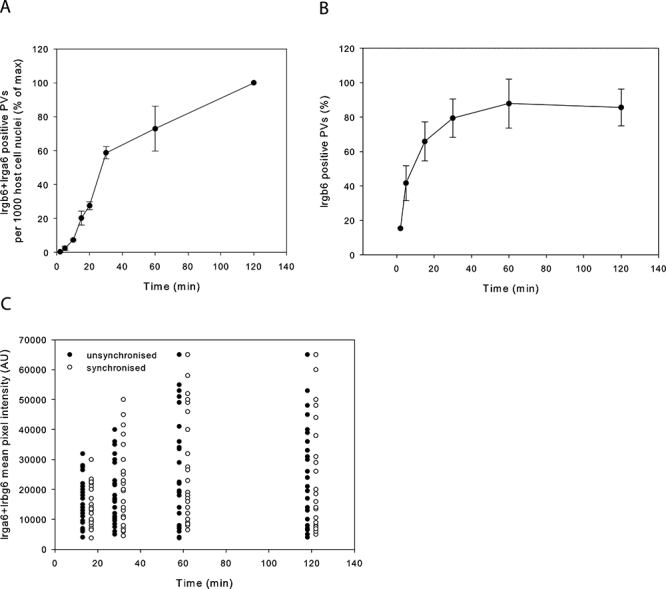
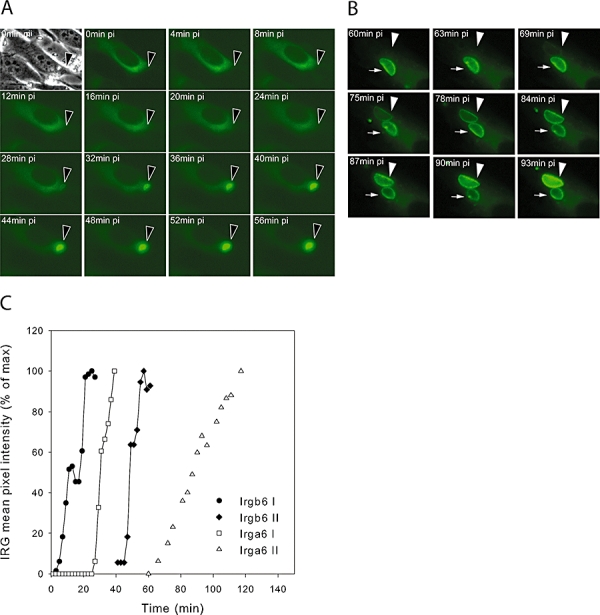
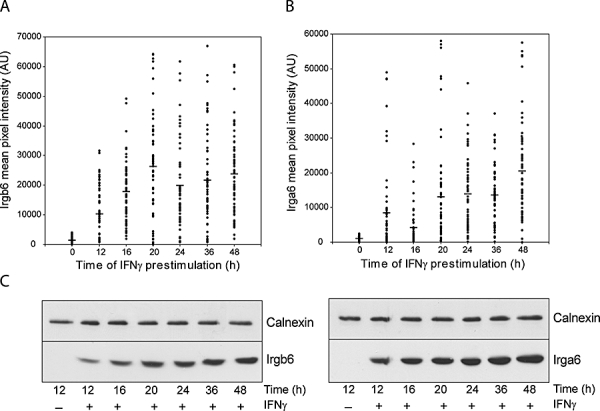
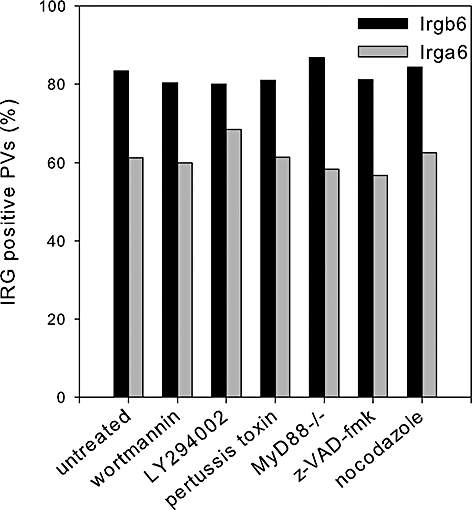
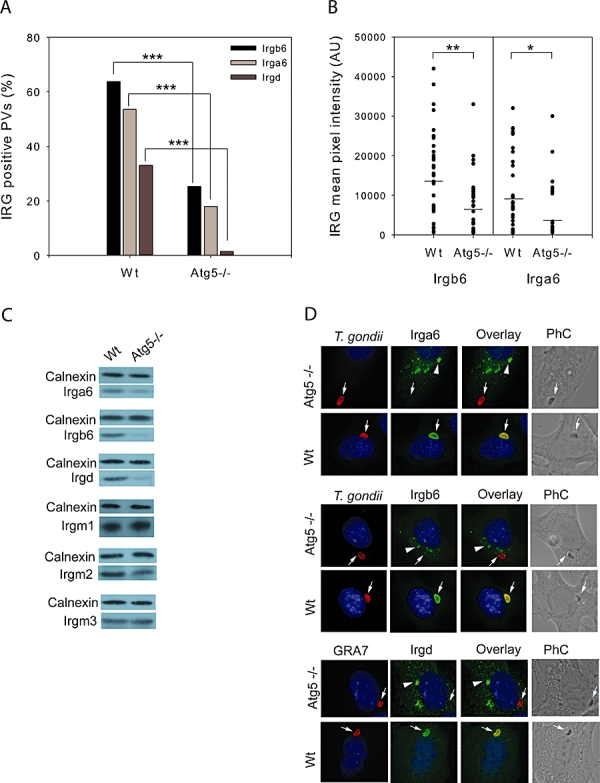
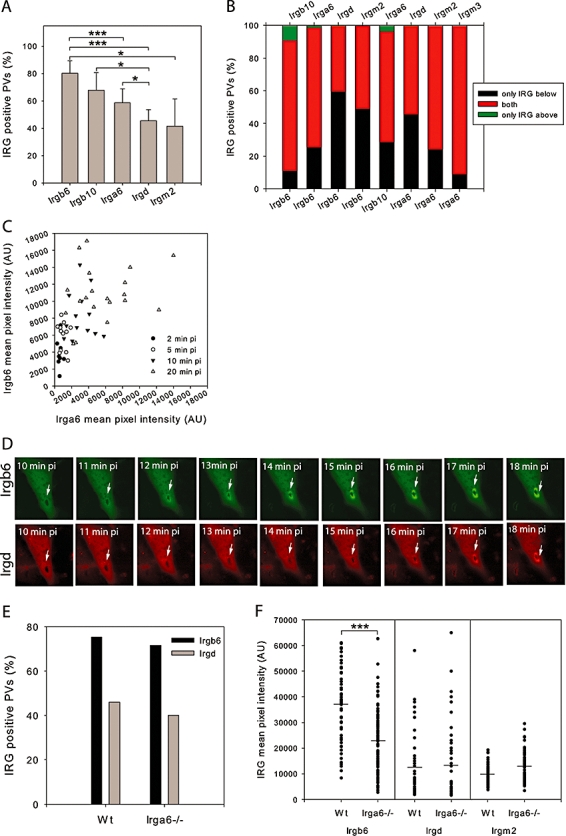
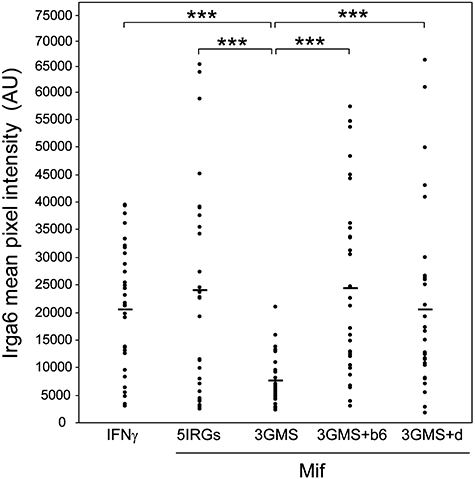
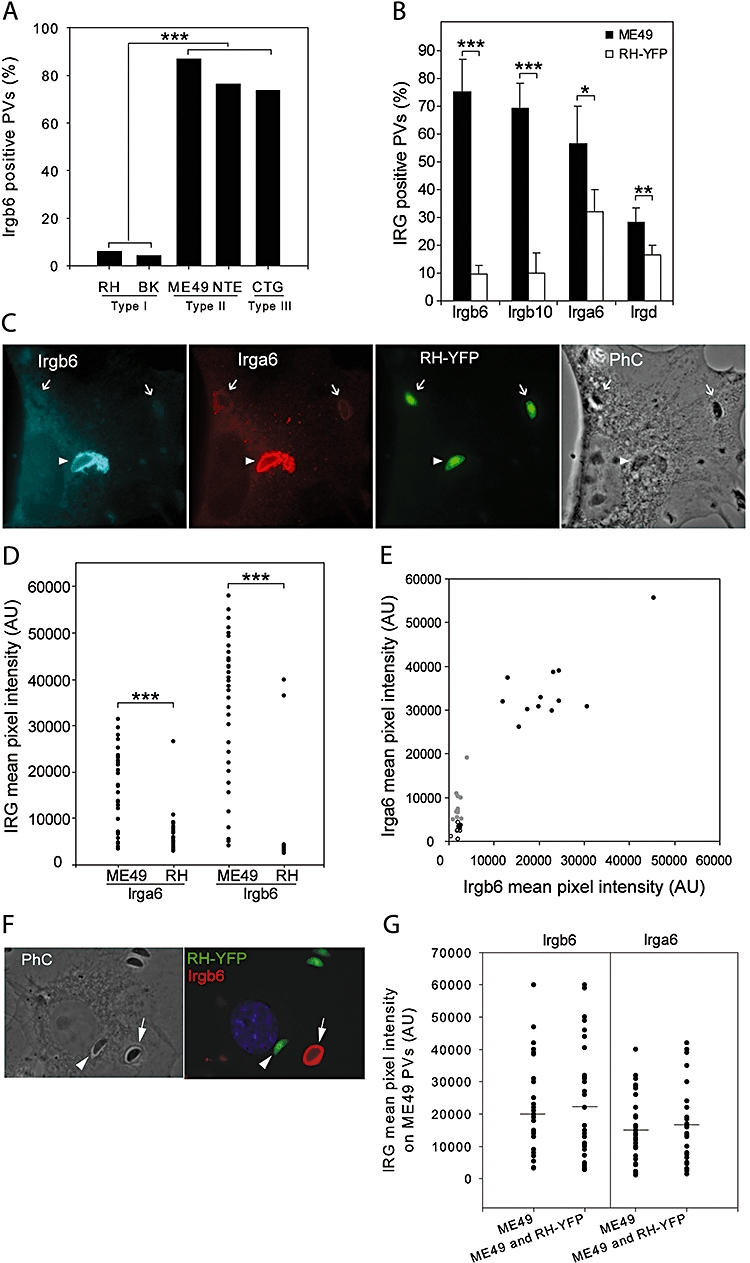
The immunity-related GTPases (IRGs) constitute an interferon-induced intracellular resistance mechanism in mice against Toxoplasma gondii. IRG proteins accumulate on the parasitophorous vacuole membrane (PVM), leading to its disruption and to death of the parasite. How IRGs target the PVM is unknown. We show that accumulation of IRGs on the PVM begins minutes after parasite invasion and increases for about 1 h. Targeting occurs independently of several signalling pathways and the microtubule network, suggesting that IRG transport is diffusion-driven. The intensity of IRG accumulation on the PVM, however, is reduced in absence of the autophagy regulator, Atg5. In wild-type cells IRG proteins accumulate cooperatively on PVMs in a definite order reflecting a temporal hierarchy, with Irgb6 and Irgb10 apparently acting as pioneers. Loading of IRG proteins onto the vacuoles of virulent Toxoplasma strains is attenuated and the two pioneer IRGs are the most affected. The polymorphic rhoptry kinases, ROP16, ROP18 and the catalytically inactive proteins, ROP5A-D, are not individually responsible for this effect. Thus IRG proteins protect mice against avirulent strains of Toxoplasma but fail against virulent strains. The complex cooperative behaviour of IRG proteins in resisting Toxoplasma may hint at undiscovered complexity also in virulence mechanisms.


Figures

Fig. 1
Fig. 1
Time-course of Irga6 and Irgb6 association with T. gondii ME49 PVs. IFNγ-induced C57BL/6 MEFs were infected with T. gondii ME49 strain as described in Experimental procedures. At intervals from 2.5 min to 2 h after infection slides were prepared for staining simultaneously with antibody reagents against Irga6 (mAb 10D7) and Irgb6 (serum A20) using secondary antibodies coupled with the same fluorochrome to enhance the visible signal (A, C) or against Irgb6 (serum A20) alone (B). DAPI was used to stain the nuclei. A. Loading of IRG proteins begins early after cell penetration. Vacuoles with visible accumulations of IRG proteins on the PVM were counted per 1000 host cell nuclei at each time point and presented as a percentage of maximum. The mean of two independent repetitions and the range between them are shown. B. The frequency of Irgb6-positive vacuoles increased with time after infection. In two independent experiments Irgb6-positive PVs were counted out of 10–100 intracellular parasites at different time points after infection. Mean and ranges are given. The 2 min time point was assayed in only one experiment. C. IRG signal intensity at the PVM increased with time after infection. Fluorescent signal intensities of IRG protein (Irgb6 plus Irga6) on individual vacuoles were measured as described in Experimental procedures (see also Fig. S1) at the times indicated. Neither signal intensities nor heterogeneity were detectably affected by synchronized infection (as described in Experimental procedures) and thorough removal of free parasites by washing. Open circles: infection was synchronized and free parasites were washed off; closed circles: infection was not synchronized and free parasites were not washed off after inoculation. Twenty-five positive vacuoles were measured at each time point.
Fig. 2
Fig. 2
Loading of individual vacuoles by Irga6-ctag1-EGFP or Irgb6-FLAG-EGFP observed by time-lapse microscopy. C57BL/6 MEFs were transfected with the expression plasmid pEGFP-N3-Irga6-ctag1 or pEGFP-N3-Irgb6-FLAG and simultaneously induced with IFNγ. After 24 h, the cells were infected with T. gondii ME49 strain in microscope slide chambers as described in Zhao et al. (2009a). Cells were observed continuously in order to document the entry of individual parasites and the subsequent accumulation of Irga6-ctag1-EGFP or Irgb6-FLAG-EGFP on the PV. A. and B. Selected frames of two time-lapse videos of Irga6-ctag1-EGFP loading on ME49 T. gondii PV. Arrowheads indicate the location of the analysed T. gondii PVs. The arrow in (B) indicates a T. gondii vacuole already loaded with Irga6-ctag1-EGFP before the initiation of the movie (see also text). [Note that the frames shown in (B) are not a regular time series as some frames were out of focus and have not been included]. The videos from which frames in (A and B) were extracted are presented as Videos S1 and S2 respectively. pi, post inoculation. C. Mean pixel intensities of Irga6 and Irgb6 at the PVM were measured from the vacuoles shown in (A and B) (Irga6 I and Irga6 II respectively) and from two further videos of Irgb6 (Irgb6 I and Irgb6 II; these frames are shown in Fig. S1D), and plotted as percentage of the maximum intensity. The origin on the time axis is the time of addition of T. gondii to the cells. The first symbol of each plot gives the time when the observed parasite was seen to enter the cell. In the case of the Irgb6 I movie the protein signal slightly decreased after 13 min because of focus drift on the 15 and 17 min frames and resumed its rise after correction.
Fig. 3
Fig. 3
Influence of duration of IFNγ induction on Irga6 and Irgb6 protein levels and on vacuolar loading. MEFs were induced for different times with IFNγ before infection with T. gondii strain ME49 for 2 h and stained in immunofluorescence against Irga6 and Irgb6. Co-staining against GRA7 was used to determine intracellular parasites. A. and B. The pixel intensities of (A) Irgb6 (serum A20) and (B) Irga6 (serum 165) signals at the PVM of ME49 vacuoles were determined as described in Experimental procedures (see also Fig. S1) and displayed as a function of IFNγ induction time. Sixty PVs were quantified per time point and the arithmetic means are given as horizontal lines. C. In parallel sample cell lysates from MEFs induced for the indicated times with IFNγ were analysed by Western blot for Irga6 (mAb 10D7) and Irgb6 (mAb B34) expression level relative to calnexin as a loading control.
Fig. 4
Fig. 4
Vacuolar loading of IRG proteins is independent of major signalling systems and microtubules. C57BL/6 MEFs were induced with IFNγ and treated as described in Experimental procedures with inhibitors of PI3-kinase (wortmannin and LY294002), G protein-coupled receptors (pertussis toxin), caspases (z-VAD-fmk) and microtubule polymerization (nocodazole). Multiple TLR-mediated signals were excluded in IFNγ-induced MEFs from MyD88-deficient mice. The efficacy of each treatment was assayed as described in Experimental procedures and as shown in Fig. S2. Untreated, treated and MyD88-deficient cells were infected with T. gondii ME49 strain for 2 h and stained separately with antibody reagents against Irga6 (mAb 10D7) and Irgb6 (serum A20). The frequency of vacuoles detectably positive for Irga6 and Irgb6 was calculated as a percentage from 200–400 intracellular parasites. One representative experiment out of two independent repetitions is shown.
Fig. 5
Fig. 5
Atg5 influences loading of IRG proteins onto T. gondii PVs. A. IRG protein association with T. gondii ME49 PVs is reduced in Atg5−/− fibroblasts. Wt and Atg5−/− fibroblasts were induced for 24 h with IFNγ and infected with T. gondii ME49 strain for 2 h. Irga6-, Irgb6- and Irgd-positive vacuoles were detected by staining with mAb 10D7, serum A20 and serum 081/1 respectively. A total of 400–700 intracellular parasites were scored for each IRG protein in each cell line in 2–3 independent experiments. For statistical analysis the results for each condition were pooled. For all three IRG proteins the difference between wt and Atg5−/− was highly significant by chi-squared test, P < 0.001, indicated by *** in the figure). B. The intensity of Irgb6 and Irga6 vacuolar loading is reduced in Atg5−/− cells. Loading intensity was measured as described in Experimental procedures on at least 40 vacuoles from the experiment shown in (A). Horizontal bars represent the arithmetic mean values. By the Mann–Whitney test, for Irgb6 P < 0.01 for the difference between wt and Atg5−/−, indicated by ** in the figure, and for Irga6 P < 0.05, indicated by * in the figure). C. Irga6, Irgb6, Irgd and Irgm2 protein levels are reduced in Atg5−/− MEFs while Irgm1 and Irgm3 are unaffected. Wt and Atg5−/− fibroblasts were induced with IFNγ for 24 h and analysed by Western blot with antibody reagents detecting the following IRG proteins: Irga6 (mAb 10D7), Irgb6 (mAb B34), Irgd (serum 2078/3), Irgm2 (serum H53/3), Irgm1 (serum L115 BO) and Irgm3 (mAb anti-IGTP). D. IRG proteins form aggregates in IFNγ-induced Atg5−/− MEFs. Cells were induced with IFNγ, infected with T. gondii ME49 strain and prepared for microscopical analysis as described in (A). Rabbit anti-Toxoplasma serum (upper and middle panels) or anti-GRA7 (lower panel) monoclonal antibody was used to identify the pathogen. Arrows indicate intracellular parasites. The arrowheads indicate the IRG protein aggregates. PhC, phase contrast.
Fig. 6
Fig. 6
IRG proteins load in a consistent hierarchy on to the PV of T. gondii ME49 strain. A. Each IRG protein loads onto a characteristic proportion of vacuoles. Quantification of IRG-positive PVs (%) observed in IFNγ-induced 2 h T. gondii ME49 infected MEFs and gs3T3 cells assayed by immunocytochemistry using antibody reagents described in Fig. S4 and in Experimental procedures. At least three independent experiments were assayed and pooled and a minimum of 500 PVs counted for each IRG protein (error bars indicate the standard deviation between individual experiments). The statistical significances of the differences recorded were determined by Student's t-test and are shown on the figure (***P < 0.001; *P < 0.05). B. IRG proteins do not load at random onto each vacuole. IRG proteins loaded onto T. gondii PV were detected by co-staining with pairs of specific antibodies directed against IRG proteins at different positions in the hierarchy, using specific secondary reagents carrying different fluorochromes. Vacuoles loaded with one IRG protein were scored for possession of the second and vice versa. Vacuoles loaded with neither IRG protein were not included in the analysis. At least 100 positive vacuoles were counted for each pair of IRG proteins. Red bar segments give the percentage of vacuoles loaded with both IRG proteins in a given pair, while the green and black bar segments give respectively the percentages loaded with only the lower or only the higher member. The PV loading of pairs of IRG proteins is very strongly correlated such that nearly every vacuole loaded with an IRG protein lower down the hierarchy is also loaded with an IRG protein higher in the hierarchy. The full data are shown in Table S1. C. Irgb6 loads more heavily onto T. gondii vacuoles at early time points than Irga6. C57BL/6 MEFs were induced with IFNγ and infected with T. gondii ME49 strain. At indicated times after infection Irgb6 and Irga6 vacuole loading intensities were analysed simultaneously with specific primary antibodies (Irgb6, serum A20; Irga6, mAb 10D7) detected with secondary antibodies labelled with different fluorochromes. D. Irgb6 loads before Irgd on to the T. gondii ME49 strain PV. C57BL/6 MEFs were induced with IFNγ and transfected simultaneously with constructs expressing Irgb6-FLAG-EGFP and Irgd-ctag1-Cherry. After 24 h, cells were infected with T. gondii ME49 strain in microscope slide chambers and observed by live cell imaging for the accumulation of IRG proteins. Successive 1 min frames from one vacuole show Irgb6-FLAG-EGFP visibly loading several minutes before Irgd-ctag1-Cherry. E. Absence of Irga6 does not affect the proportion of vacuoles loaded with Irgb6 or Irgd. Irga6−/− and wt MEFs were induced with IFNγ and infected with T. gondii strain ME49. 2 h after infection cells were stained with appropriate antibody reagents and the proportion of Irgb6 (mAb B34) and Irgd (serum 081/1) labelled vacuoles (out of 300 for each IRG protein in two independent experiments) was recorded. F. Intensity of PV loading by Irgb6 is significantly reduced in Irga6−/− relative to wt MEFs (P < 0.001 by Mann–Whitney test, indicated by *** on the figure). IFNγ-induced Irga6−/− and wt MEFs were infected with T. gondii ME49 strain. Two hours after infection slides were stained for Irgb6 (B34), Irgd (081/1) and Irgm2 (H53/3). At least 50 vacuoles loaded with each IRG protein were assayed for loading intensity from both cell types. The arithmetic means are given as horizontal lines.
Fig. 7
Fig. 7
Loading of Irga6 at the T. gondii ME49 strain PV is enhanced by the presence of other IRG proteins of the GKS group. gs3T3-Irga6 cells were induced with IFNγ or Mifepristone. At the same time, Mifepristone-induced cells were transfected with pools of constructs (see Experimental procedures for experimental details) expressing either the three GMS proteins, (Irgm1, Irgm2 and Irgm3) alone to permit access of Irga6 to the PV (3GMS) or, in addition to the 3GMS proteins, also Irgb6 (3GMS + b6), Irgd (3GMS + d) or both Irgb6 and Irgd (5IRGs). After 24 h, cells were infected with T. gondii ME49 strain for 2 h. Irga6 was detected at the PV in transfected cells using mAb 10E7 in immunofluorescence. Transfected cells were identified by staining for Irgm2 with the H53/3 serum. The arithmetic means are given as horizontal lines. Vacuolar loading of Irga6 was significantly enhanced by addition of Irgb6 or Irgd. The P-values are given on the figure (***P < 0.001).
Fig. 8
Fig. 8
Accumulation of IRG proteins on the PVM is reduced in virulent T. gondii infection. A. IFNγ-induced MEFs were infected for 2 h with type I virulent (RH and BK), type II (ME49 and NTE) and type III (CTG) avirulent T. gondii strains and assayed microscopically for Irgb6-positive vacuoles (serum A20). Irgb6-positive PVs were counted for each parasite strain from 400–600 intracellular parasites in two independent experiments and pooled. The differences between the avirulent types II and III strains and the virulent type I strains are highly significant by chi-squared test (***P < 0.001). B. gs3T3 cells were induced with IFNγ and infected with T. gondii ME49 strain (black bars) or RH-YFP strain (white bars). Numbers of Irgb6-, Irgb10-, Irga6- and Irgd-positive PVs were counted in 3–6 experiments for each IRG protein and T. gondii strain and given as a percentage of intracellular parasites. More than 200 intracellular parasites were counted blind per experiment. The mean percentages of positive vacuoles of ME49 or RH-YFP type for each IRG protein are shown. Error bars indicate the standard deviations. The significances of the differences between loading of ME49 and RH-YFP vacuoles are given on the figure (***P < 0.001, **P < 0.01, *P < 0.05, by Student's t-test). C. C57BL/6 MEFs were induced with IFNγ and infected with RH-YFP. Irgb6 (blue) and Irga6 (red) were detected in immunofluorescence with serum A20 and mAb 10E7 respectively. Intracellular fluorescent parasites (RH-YFP, green) identified in phase contrast (PhC) are indicated by white arrowheads (strongly IRG-positive) and arrows (weakly IRG-positive). D. gs3T3 fibroblasts were induced with IFNγ and infected with either ME49 or RH-YFP T. gondii strains. Mean fluorescence intensities of Irga6 (serum 165/3) and Irgb6 (serum A20) signals at the PVM were quantified as described in Fig. S1 and Experimental procedures. Thirty-five random PVs per data set were quantified blind. For both Irga6 and Irgb6, the different loading intensities on ME49 and RH-YFP vacuoles were highly significant (***P < 0.001). E. C57BL/6 MEFs were induced with IFNγ and infected with T. gondii RH-YFP strain. Mean fluorescence intensities of Irga6 and Irgb6 were measured for selected PVs expressing no detectable (open circles), weak (grey filled circles) or strong Irga6 staining (black filled circles). The fluorescent intensity profiles of five representative PVs per group are displayed in Fig. S6. F. Photomicrograph of an IFNγ-stimulated MEF shown 2 h after double infection with ME49 strain (indicated by arrowhead) and RH-YFP strain T. gondii (green, indicated by arrow). The ME49 strain parasite shows intense Irgb6 (serum A20, red) accumulation at the PV while the RH-YFP in the same cell has no Irgb6 on the PV. G. IFNγ-stimulated MEFs were infected with T. gondii ME49 strain alone or simultaneously with ME49 and RH-YFP strains. Irgb6 (detected by serum A20) and Irga6 (detected by mAb 10D7) fluorescence intensities were measured on at least 30 ME49 PVs in singly and doubly infected cells. ME49 and RH-YFP were discriminated by the fluorescent signal from RH-YFP. The arithmetic means are given as horizontal lines. The loading of Irga6 and Irgb6 onto PVs of avirulent ME49 strain T. gondii was unaffected by the simultaneous presence of virulent RH-YFP.
Fig. 9
Fig. 9
ROP18, ROP16 and ROP5 virulence-associated T. gondii proteins do not affect IRG-mediated control of the parasite. A. Ectopically expressed ROP18 does not affect loading of T. gondii ME49 PVs with Irgb6 in infected L929 cells. L929 cells were induced with IFNγ, transfected with pGW1H expression plasmids encoding the mature form of ROP18 from either ME49 or RH-YFP T. gondii strains, or pmCherry-N3 as a transfection control and infected for 2 h with T. gondii ME49 strain. Cells were stained for Irgb6 (serum A20) and for Ty-tag to identify the transfected cells. Irgb6-positive vacuoles in ROP18-Ty-tag and Cherry-positive cells were enumerated. A total of approximately 700 vacuoles were scored in two independent experiments. B. ROP16 and ROP5A–D do not affect Irgb6 loading onto T. gondii PV. IFNγ-stimulated MEFs were infected with the S22-LC37 T. gondii strain expressing four ROP5 and two other genes (see also Experimental procedures and main text), RH-Δrop16 and control parental strains S22 and RH for 2 h. Irgb6-positive PVs (stained with serum 141/1) were quantified from 350–500 intracellular parasites. The results shown are pooled from two independent experiments. C. The IFNγ-mediated growth inhibition of RH-Δrop16 and S22-LC37 T. gondii strains are comparable in each case to the inhibition of the respective RH and S22 control strains in MEFs. Proliferation of T. gondii strains was measured by 3H-uracil incorporation and presented as a percentage of T. gondii growth inhibition, as described in Experimental procedures. Black and grey bars represent the extent of parasite growth inhibition at 10 and 100 U ml−1 of IFNγ cell stimulation respectively. See Fig. S7 for untransformed data.

Similar articles

Cited by

References

    1. Adachi O, Kawai T, Takeda K, Matsumoto M, Tsutsui H, Sakagami M, et al. Targeted disruption of the MyD88 gene results in loss of IL-1- and IL-18-mediated function. Immunity. 1998;9:143–150. - PubMed
    1. Bastin P, Bagherzadeh Z, Matthews KR, Gull K. A novel epitope tag system to study protein targeting and organelle biogenesis in Trypanosoma brucei. Mol Biochem Parasitol. 1996;77:235–239. - PubMed
    1. Bekpen C, Hunn JP, Rohde C, Parvanova I, Guethlein L, Dunn DM, et al. The interferon-inducible p47 (IRG) GTPases in vertebrates: loss of the cell autonomous resistance mechanism in the human lineage. Genome Biol. 2005;6:R92. - PMC - PubMed
    1. Bernstein-Hanley I, Coers J, Balsara ZR, Taylor GA, Starnbach MN, Dietrich WF. The p47 GTPases Igtp and Irgb10 map to the Chlamydia trachomatis susceptibility locus Ctrq-3 and mediate cellular resistance in mice. Proc Natl Acad Sci USA. 2006;103:14092–14097. - PMC - PubMed
    1. Boehm U. Studien zur Charakterisierung der zellulaeren Antwort auf Interferon-γ. Cologne: University of Cologne; 1999. p. 193.

Publication types

Substances