

Relationship between operon preference and functional properties of persistent genes in bacterial genomes
- PMID: 20109203
- PMCID: PMC2837039
- DOI: 10.1186/1471-2164-11-71
Relationship between operon preference and functional properties of persistent genes in bacterial genomes
Abstract
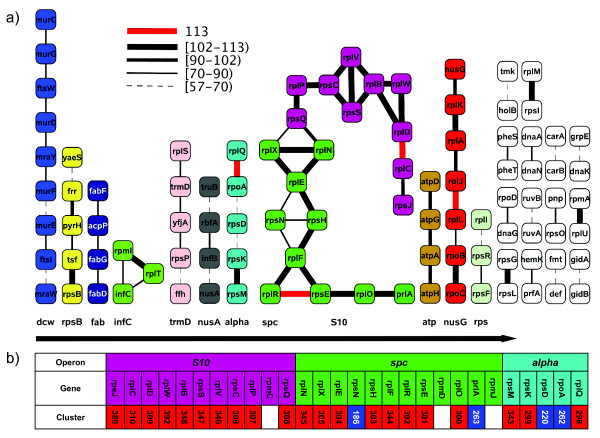
Background: Genes in bacteria may be organised into operons, leading to strict co-expression of the genes that participate in the same operon. However, comparisons between different bacterial genomes have shown that much of the operon structure is dynamic on an evolutionary time scale. This indicates that there are opposing effects influencing the tendency for operon formation, and these effects may be reflected in properties like evolutionary rate, complex formation, metabolic pathways and gene fusion.
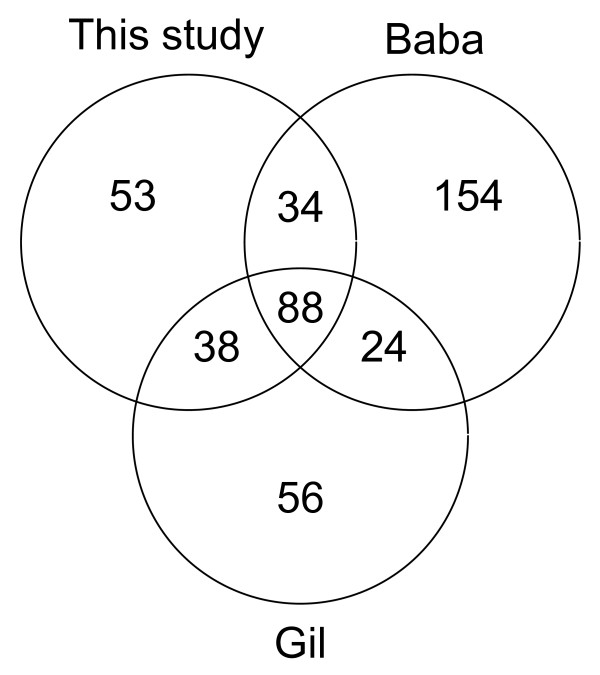
Results: We have used multi-species protein-protein comparisons to generate a high-quality set of genes that are persistent in bacterial genomes (i.e. they have close to universal distribution). We have analysed these genes with respect to operon participation and important functional properties, including evolutionary rate and protein-protein interactions.
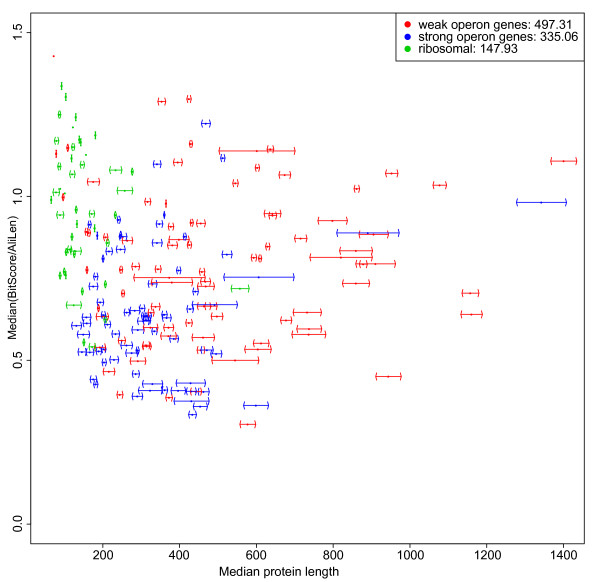
Conclusions: Genes for ribosomal proteins show a very slow rate of evolution. This is consistent with a strong tendency for the genes to participate in operons and for their proteins to be involved in essential and well defined complexes. Persistent genes for non-ribosomal proteins can be separated into two classes according to tendency to participate in operons. Those with a strong tendency for operon participation make proteins with fewer interaction partners that seem to participate in relatively static complexes and possibly linear pathways. Genes with a weak tendency for operon participation tend to produce proteins with more interaction partners, but possibly in more dynamic complexes and convergent pathways. Genes that are not regulated through operons are therefore more evolutionary constrained than the corresponding operon-associated genes and will on average evolve more slowly.
Figures

Similar articles
-
Genome alignment, evolution of prokaryotic genome organization, and prediction of gene function using genomic context.Genome Res. 2001 Mar;11(3):356-72. doi: 10.1101/gr.gr-1619r. Genome Res. 2001. PMID: 11230160
-
Detecting uber-operons in prokaryotic genomes.Nucleic Acids Res. 2006 May 8;34(8):2418-27. doi: 10.1093/nar/gkl294. Print 2006. Nucleic Acids Res. 2006. PMID: 16682449 Free PMC article.
-
Evolution of mosaic operons by horizontal gene transfer and gene displacement in situ.Genome Biol. 2003;4(9):R55. doi: 10.1186/gb-2003-4-9-r55. Epub 2003 Aug 29. Genome Biol. 2003. PMID: 12952534 Free PMC article.
-
Ancient origin of the tryptophan operon and the dynamics of evolutionary change.Microbiol Mol Biol Rev. 2003 Sep;67(3):303-42, table of contents. doi: 10.1128/MMBR.67.3.303-342.2003. Microbiol Mol Biol Rev. 2003. PMID: 12966138 Free PMC article. Review.
-
A computational system for identifying operons based on RNA-seq data.Methods. 2020 Apr 1;176:62-70. doi: 10.1016/j.ymeth.2019.03.026. Epub 2019 Apr 4. Methods. 2020. PMID: 30953757 Free PMC article. Review.
Cited by
-
Cold plasma effect on the proteome of Pseudomonas aeruginosa - Role for bacterioferritin.PLoS One. 2018 Oct 26;13(10):e0206530. doi: 10.1371/journal.pone.0206530. eCollection 2018. PLoS One. 2018. PMID: 30365553 Free PMC article.
-
Challenges and Perspective in Integrated Multi-Omics in Gut Microbiota Studies.Biomolecules. 2021 Feb 17;11(2):300. doi: 10.3390/biom11020300. Biomolecules. 2021. PMID: 33671370 Free PMC article. Review.
-
Evolution and Domestication of a Novel Biosynthetic Gene Cluster Contributing to the Flavonoid Metabolism and High-Altitude Adaptability of Plants in the Fagopyrum Genus.Adv Sci (Weinh). 2024 Nov;11(43):e2403603. doi: 10.1002/advs.202403603. Epub 2024 Sep 23. Adv Sci (Weinh). 2024. PMID: 39312476 Free PMC article.
-
Functional Operons in Secondary Metabolic Gene Clusters in Glarea lozoyensis (Fungi, Ascomycota, Leotiomycetes).mBio. 2015 Jun 16;6(3):e00703. doi: 10.1128/mBio.00703-15. mBio. 2015. PMID: 26081635 Free PMC article.
-
A Transcriptome Map of Actinobacillus pleuropneumoniae at Single-Nucleotide Resolution Using Deep RNA-Seq.PLoS One. 2016 Mar 28;11(3):e0152363. doi: 10.1371/journal.pone.0152363. eCollection 2016. PLoS One. 2016. PMID: 27018591 Free PMC article.
References
Publication types
MeSH terms
Substances
LinkOut - more resources
Full Text Sources
