. 2010 Jan 28;11(1):R10.
doi: 10.1186/gb-2010-11-1-r10.

Characterization of X-linked SNP genotypic variation in globally distributed human populations

Affiliations

Characterization of X-linked SNP genotypic variation in globally distributed human populations

Amanda M Casto et al. Genome Biol. .

Abstract

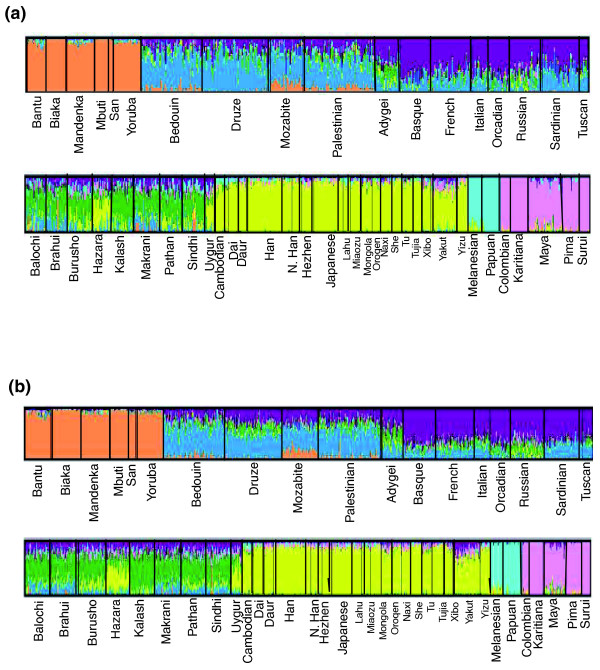
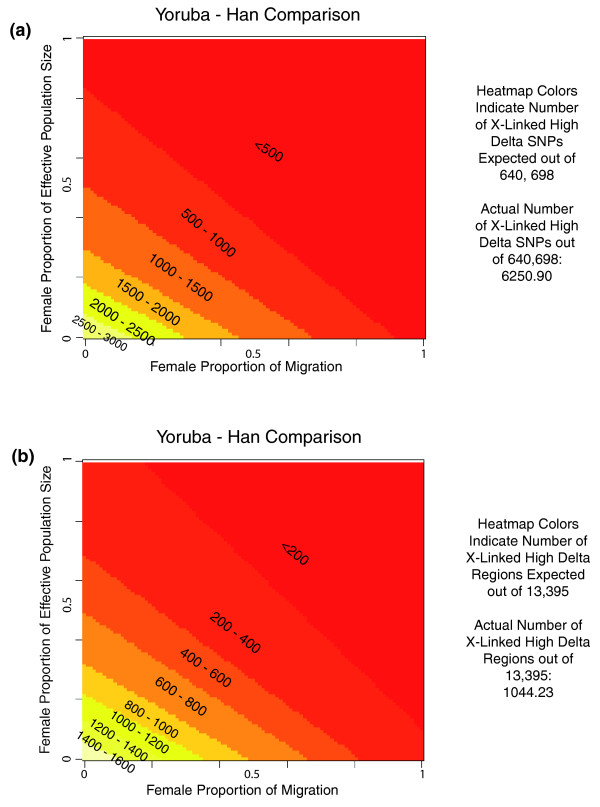
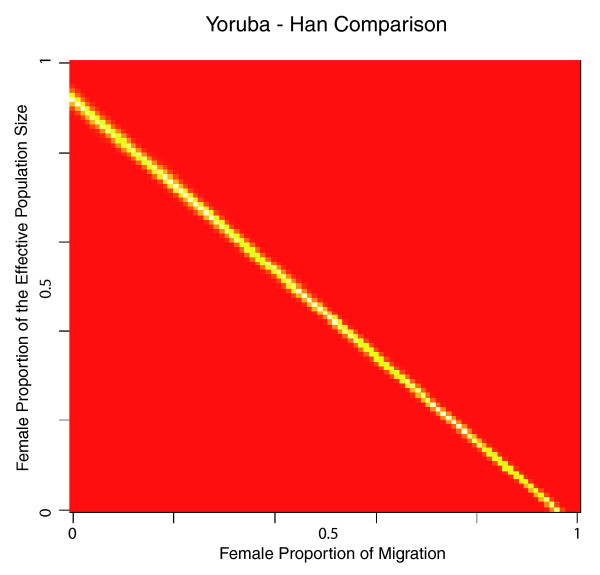
Background: The transmission pattern of the human X chromosome reduces its population size relative to the autosomes, subjects it to disproportionate influence by female demography, and leaves X-linked mutations exposed to selection in males. As a result, the analysis of X-linked genomic variation can provide insights into the influence of demography and selection on the human genome. Here we characterize the genomic variation represented by 16,297 X-linked SNPs genotyped in the CEPH human genome diversity project samples.

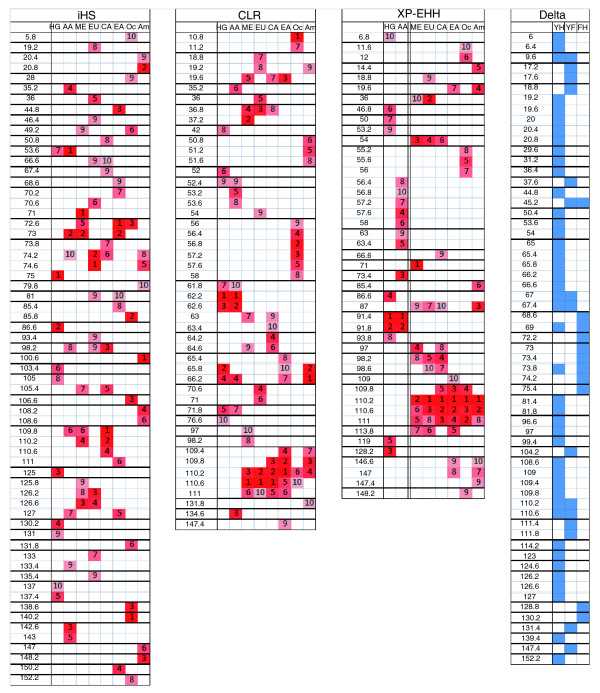
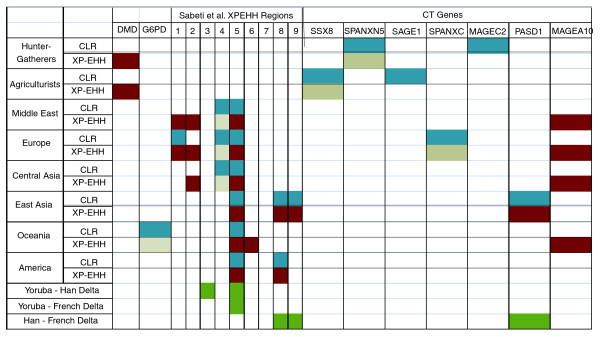
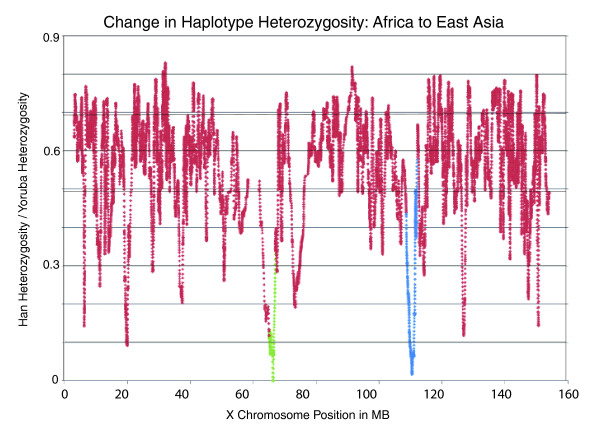
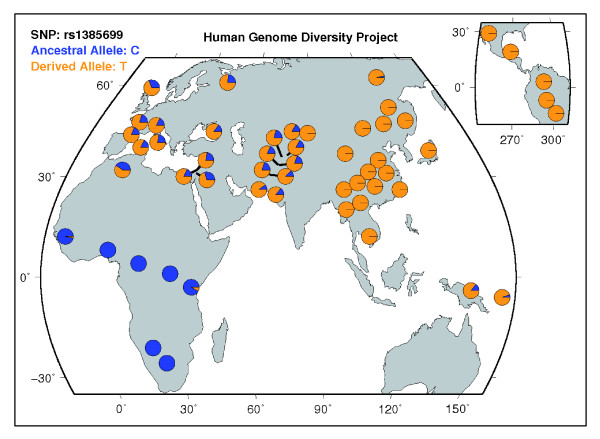
Results: We found that X chromosomes tend to be more differentiated between human populations than autosomes, with several notable exceptions. Comparisons between genetically distant populations also showed an excess of X-linked SNPs with large allele frequency differences. Combining information about these SNPs with results from tests designed to detect selective sweeps, we identified two regions that were clear outliers from the rest of the X chromosome for haplotype structure and allele frequency distribution. We were also able to more precisely define the geographical extent of some previously described X-linked selective sweeps.

Conclusions: The relationship between male and female demographic histories is likely to be complex as evidence supporting different conclusions can be found in the same dataset. Although demography may have contributed to the excess of SNPs with large allele frequency differences observed on the X chromosome, we believe that selection is at least partially responsible. Finally, our results reveal the geographical complexities of selective sweeps on the X chromosome and argue for the use of diverse populations in studies of selection.


Figures

Figure 1
Figure 1
Structure of the CEPH-HGDP Populations as estimated using frappe. Figures drawn using Distruct [45]. (a) Population structure estimated using 16,297 X chromosome SNP genotypes with K = 7. (b) Population structure estimated using 19,632 chromosome 16 SNP genotypes with K = 7.
Figure 2
Figure 2
Number of high-delta SNPs and regions represented by TA/EX values for the Yoruba-Han comparison. (a) The female proportion of the effective population size and the female proportion of migration were both varied over a range from 0.01 to 0.99. For each of the 9,800 possible pairs of these values, a list of TA/EX values was produced from the observed autosomal delta values for the Yoruba-Han. The color at a given point on the grid represents the number of high-delta SNPs out of 640,698 total SNPs found in this list. (b) The same as in (a), except that the color at a given point on the grid signifies the number of high-delta regions out of 13,395 total regions represented by each list of TA/EX delta values.
Figure 3
Figure 3
Comparison of TA/EX and observed X-linked delta values. The female proportion of the effective population size and the female proportion of migration were both varied over a range from 0.01 to 0.99. For each of the 9,800 possible pairs of these values, a list of TA/EX delta values was produced from the observed autosomal delta values for the Yoruba-Han comparison. This list of TA/EX values was compared to the list of observed X-linked delta values using a two-sided Wilcoxon test. The color at a given point represents the resulting P-value of this comparison. Red locations on the grid represent Nf/N, mf/m value-pairs that produce sets of TA/EX delta values that significantly differ from the observed X-linked values; white and yellow regions on the grid represent Nf/N, mf/m value-pairs that produce TA/EX values that do not significantly differ from the observed X-linked values.
Figure 4
Figure 4
Top ten regions for iHS, CLR, and XP-EHH scores and all high-delta regions. The numbers on the left side of each figure represent the beginning position of a region in megabases. Each chromosomal region is 400-kb in length. The letters across the top of each figure represent the eight continental regions: HG, hunter-gatherer; AA, African agriculturist; ME, Middle East; EU, Europe; CA, Central Asia; EA, East Asia; Oc, Oceania; Am, America. In the delta figure, the column labels represent the three population comparisons: YH, Yoruba-Han; YF, Yoruba-French; FH, French-Han. For iHS, CLR, and XP-EHH, each small column contains the numbers 1 to 10 denoting the top ten X-chromosomal regions for each particular test and continental group with the intensity of the color corresponding to the rank. For XP-EHH, the double line separating the African agriculturist column from the Middle East column signifies that the XP-EHH scores represented on the left side of the lines were calculated using East Asians as the reference sample while the scores represented on the right side of the lines were calculated using African agriculturists as the reference sample (Additional file 9). For delta, each blue shaded region contains either a high-delta SNP for the Yoruba-Han or Yoruba-French comparison, or a SNP with delta > 0.8 for the French-Han comparison.
Figure 5
Figure 5
Previously implicated X-linked selection targets with elevated CLR, XP-EHH, or delta scores. Each row represents a particular delta comparison or a particular test as labeled. Each column represents a X-chromosomal region or locus that previous research has identified as being under selection. Colored boxes designate regions where elevated test scores were observed (see text and Materials and methods for details); blue boxes represent elevated CLR scores, red boxes represent elevated XP-EHH scores, and green boxes represent elevated delta values. Gray boxes denote regions where there are no scores for the corresponding test.
Figure 6
Figure 6
Change in haplotype heterozygosity between African agriculturists and East Asians. All sets of five consecutive X-linked SNPs were assembled into haplotypes. Haplotype heterozygosity was then calculated for all haplotypes in the Yoruba and the Han. The abscissa represents the chromosomal position of the center SNP while the ordinate gives the value of the Han heterozygosity as a proportion of the Yoruba heterozygosity (Han heterozygosity/Yoruba heterozygosity). The green data points represent haplotypes centered between 65 and 67 Mb and the blue data points represent haplotypes centered between 108.6 and 112.2 Mb.
Figure 7
Figure 7
Frequency spectra of rs1385699 in CEPH-HGDP populations. rs1385699 is a non-synonymous SNP located in EDA2R. This image was downloaded from the UCSC Genome Browser Website [47].

Similar articles

Cited by

References

    1. Rosenberg NA, Pritchard JK, Weber JL, Cann HM, Kidd KK, Zhivotovsky LA, Feldman MW. Genetic structure of human populations. Science. 2002;298:2381–2385. doi: 10.1126/science.1078311. - DOI - PubMed
    1. Ramachandran S, Rosenberg NA, Zhivotovsky LA, Feldman MW. Robustness of the inference of human population structure: A comparison of X-chromosomal and autosomal microsatellites. Hum Genomics. 2004;1:87–97. - PMC - PubMed
    1. Li JZ, Absher DM, Tang H, Southwick AM, Casto AM, Ramachandran S, Cann HM, Barsh GS, Feldman MW, Cavalli-Sforza LL, Myers RM. Worldwide human relationships inferred from genome-wide patterns of variation. Science. 2008;319:1100–1104. doi: 10.1126/science.1153717. - DOI - PubMed
    1. Bustamante CD, Ramachandran S. Evaluating signatures of sex-specific processes in the human genome. Nat Genet. 2009;41:8–10. doi: 10.1038/ng0109-8. - DOI - PMC - PubMed
    1. Keinan A, Mullikin JC, Patterson N, Reich D. Accelerated genetic drift on chromosome X during the human dispersal out of Africa. Nat Genet. 2009;41:66–70. doi: 10.1038/ng.303. - DOI - PMC - PubMed

Publication types