Dispersal and population structure at different spatial scales in the subterranean rodent Ctenomys australis
- PMID: 20109219
- PMCID: PMC2828403
- DOI: 10.1186/1471-2156-11-9
Dispersal and population structure at different spatial scales in the subterranean rodent Ctenomys australis
Abstract
Background: The population genetic structure of subterranean rodent species is strongly affected by demographic (e.g. rates of dispersal and social structure) and stochastic factors (e.g. random genetic drift among subpopulations and habitat fragmentation). In particular, gene flow estimates at different spatial scales are essential to understand genetic differentiation among populations of a species living in a highly fragmented landscape. Ctenomys australis (the sand dune tuco-tuco) is a territorial subterranean rodent that inhabits a relatively secure, permanently sealed burrow system, occurring in sand dune habitats on the coastal landscape in the south-east of Buenos Aires province, Argentina. Currently, this habitat is threatened by urban development and forestry and, therefore, the survival of this endemic species is at risk. Here, we assess population genetic structure and patterns of dispersal among individuals of this species at different spatial scales using 8 polymorphic microsatellite loci. Furthermore, we evaluate the relative importance of sex and habitat configuration in modulating the dispersal patterns at these geographical scales.
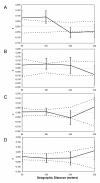
Results: Our results show that dispersal in C. australis is not restricted at regional spatial scales (approximately 4 km). Assignment tests revealed significant population substructure within the study area, providing support for the presence of two subpopulations from three original sampling sites. Finally, male-biased dispersal was found in the Western side of our study area, but in the Eastern side no apparent philopatric pattern was found, suggesting that in a more continuous habitat males might move longer distances than females.
Conclusions: Overall, the assignment-based approaches were able to detect population substructure at fine geographical scales. Additionally, the maintenance of a significant genetic structure at regional (approximately 4 km) and small (less than 1 km) spatial scales despite apparently moderate to high levels of gene flow between local sampling sites could not be explained simply by the linear distance among them. On the whole, our results support the hypothesis that males disperse more frequently than females; however they do not provide support for strict philopatry within females.
Figures


Similar articles
-
Influences of landscape characteristics and historical barriers on the population genetic structure in the endangered sand-dune subterranean rodent Ctenomys australis.Genetica. 2020 Aug;148(3-4):149-164. doi: 10.1007/s10709-020-00096-1. Epub 2020 May 25. Genetica. 2020. PMID: 32451787
-
Landscape genetics in the subterranean rodent Ctenomys "chasiquensis" associated with highly disturbed habitats from the southeastern Pampas region, Argentina.Genetica. 2017 Dec;145(6):575-591. doi: 10.1007/s10709-017-9983-9. Epub 2017 Sep 13. Genetica. 2017. PMID: 28905157
-
Phylogeographical structure in the subterranean tuco-tuco Ctenomys talarum (Rodentia: Ctenomyidae): contrasting the demographic consequences of regional and habitat-specific histories.Mol Ecol. 2007 Aug;16(16):3453-65. doi: 10.1111/j.1365-294X.2007.03398.x. Mol Ecol. 2007. PMID: 17688545
-
Genetic structure in a solitary rodent (Ctenomys talarum): implications for kinship and dispersal.Mol Ecol. 2005 Jul;14(8):2511-23. doi: 10.1111/j.1365-294X.2005.02551.x. Mol Ecol. 2005. PMID: 15969731
-
The role of chromosomal rearrangements and geographical barriers in the divergence of lineages in a South American subterranean rodent (Rodentia: Ctenomyidae: Ctenomys minutus).Heredity (Edinb). 2013 Oct;111(4):293-305. doi: 10.1038/hdy.2013.49. Epub 2013 Jun 12. Heredity (Edinb). 2013. PMID: 23759727 Free PMC article.
Cited by
-
Restricted dispersal determines fine-scale spatial genetic structure of Mongolian gerbils.Curr Zool. 2017 Dec;63(6):687-691. doi: 10.1093/cz/zox044. Epub 2017 Jul 14. Curr Zool. 2017. PMID: 29492030 Free PMC article.
-
Redefining the Distributional Boundaries and Phylogenetic Relationships for Ctenomids From Central Argentina.Front Genet. 2021 Aug 4;12:698134. doi: 10.3389/fgene.2021.698134. eCollection 2021. Front Genet. 2021. PMID: 34422000 Free PMC article.
-
Lack of conspicuous sex-biased dispersal patterns at different spatial scales in an Asian endemic goose species breeding in unpredictable steppe wetlands.Ecol Evol. 2020 Jun 27;10(14):7006-7020. doi: 10.1002/ece3.6382. eCollection 2020 Jul. Ecol Evol. 2020. PMID: 32760508 Free PMC article.
-
Genetic differentiation of geographic populations of Rattus tanezumi based on the mitochondrial Cytb gene.PLoS One. 2021 Mar 18;16(3):e0248102. doi: 10.1371/journal.pone.0248102. eCollection 2021. PLoS One. 2021. PMID: 33735257 Free PMC article.
-
Diversity of tuco-tucos (Ctenomys, Rodentia) in the Northeastern wetlands from Argentina: mitochondrial phylogeny and chromosomal evolution.Genetica. 2012 Jun;140(4-6):125-36. doi: 10.1007/s10709-012-9664-7. Epub 2012 Jul 19. Genetica. 2012. PMID: 22810419
References
-
- Gaggiotti OE, Hanski I. In: Ecology, Genetics, and Evolution of Metapopulations. Gaggiotti O, Hanski I, editor. Elsevier Academic Press, San Diego, California, USA; 2004. Mechanisms of Population Extinction; pp. 337–366. full_text.
-
- Steinberg EK, Patton JL. In: Life Underground: The Biology of Subterranean Rodents. Lacey EA, Patton JL, Cameron GN, editor. University of Chicago Press, Chicago and London; 2000. Genetic Structure and the Geography of Speciation in Subterranean Rodents: Opportunities and Constraints for Evolutionary Diversification; pp. 301–331.
Publication types
MeSH terms
LinkOut - more resources
Full Text Sources

