. 2010 Jan 28:11:65.
doi: 10.1186/1471-2105-11-65.

Haplotype allelic classes for detecting ongoing positive selection

Affiliations

Haplotype allelic classes for detecting ongoing positive selection

Julie Hussin et al. BMC Bioinformatics. .

Abstract

Background: Natural selection eliminates detrimental and favors advantageous phenotypes. This process leaves characteristic signatures in underlying genomic segments that can be recognized through deviations in allelic or haplotypic frequency spectra. To provide an identifiable signature of recent positive selection that can be detected by comparison with the background distribution, we introduced a new way of looking at genomic polymorphisms: haplotype allelic classes.

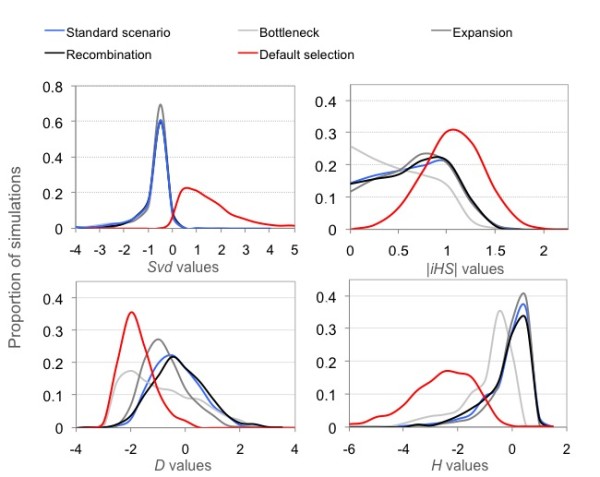
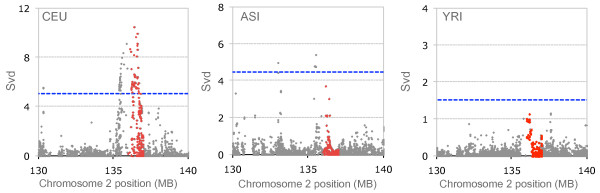
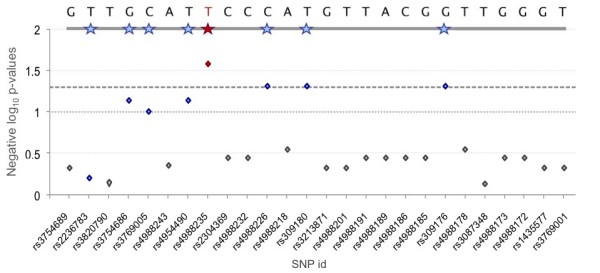
Results: The model combines segregating sites and haplotypic information in order to reveal useful data characteristics. We developed a summary statistic, Svd, to compare the distribution of the haplotypes carrying the selected allele with the distribution of the remaining ones. Coalescence simulations are used to study the distributions under standard population models assuming neutrality, demographic scenarios and selection models. To test, in practice, haplotype allelic class performance and the derived statistic in capturing deviation from neutrality due to positive selection, we analyzed haplotypic variation in detail in the locus of lactase persistence in the three HapMap Phase II populations.

Conclusions: We showed that the Svd statistic is less sensitive than other tests to confounding factors such as demography or recombination. Our approach succeeds in identifying candidate loci, such as the lactase-persistence locus, as targets of strong positive selection and provides a new tool complementary to other tests to study natural selection in genomic data.


Figures

Figure 1
Figure 1
Simulated distribution of Svd, iHS, D and H in neutrally evolving populations and under an ongoing selective sweep.
Figure 2
Figure 2
Power of Svd to detect ongoing selective sweeps.
Figure 3
Figure 3
Impact of experimental bias on the detection power of Svd.
Figure 4
Figure 4
Top Svd values in the 50- to 200-Mb region of the human chromosome 2, based on the sliding window scan in the ASI population sample, using different haplotype length (window size). For clarity, only the values in the 99th percentile of the computed Svd > 0 are plotted. Bottom plot shows variation in the fine-scale recombination rate ρ estimated using InfRec [35]. The colored boxes indicate the location of six loci previously identified as targets of selection [25-27]. The gray shading boxes indicate the location of two new loci, where clustered signals found by our approach suggest positive selection as well.
Figure 5
Figure 5
Positive Svd values in a 10-Mb region of chromosome 2. Plots of Svd > 0 for the three HapMap populations using a window size of 800 SNPs. Svd values plotted above the dashed blue lines are in the 99th percentile of all positive values computed for the whole chromosome 2 in each of the population samples. The 1-Mb segment containing the LCT and MCM6 genes is plotted in red. A strong and clear signal of positive selection is found in this region in CEU, while no signal is detected in the two other populations.
Figure 6
Figure 6
Using the Svd test at the MCM6 locus. Plot of the negative log p-values for the 26 SNPs in the MCM6 locus in CEU. The reference major allele frequency haplotype is shown on top. Stars indicate derived alleles and the red star corresponds to the T-13910 mutation (rs4988235), believed to be responsible for the trait in Europeans [28]. P-values were obtained as described in Methods and the dotted and dashed line delimit p = 0.1 and p = 0.05 cutoff, respectively.

Similar articles

Cited by

References

    1. Kim Y, Nielsen R. Linkage disequilibrium as a signature of selective sweeps. Genetics. 2004;167(3):1513–1524. doi: 10.1534/genetics.103.025387. - DOI - PMC - PubMed
    1. Voight BF, Kudaravalli S, Wen X, Pritchard JK. A map of recent positive selection in the human genome. PLoS Biol. 2006;4(3):e72. doi: 10.1371/journal.pbio.0040072. - DOI - PMC - PubMed
    1. Sabeti PC, Reich DE, Higgins JM, Levine HZ, Richter DJ, Schaffner SF, Gabriel SB, Platko JV, Patterson NJ, McDonald GJ, Ackerman HC, Campbell SJ, Altshuler D, Cooper R, Kwiatkowski D, Ward R, Lander ES. Detecting recent positive selection in the human genome from haplotype structure. Nature. 2002;419(6909):832–837. doi: 10.1038/nature01140. - DOI - PubMed
    1. Sabeti PC, Schaffner SF, Fry B, Lohmueller J, Varilly P, Shamovsky O, Palma A, Mikkelsen TS, Altshuler D, Lander ES. Positive natural selection in the human lineage. Science. 2006;312(5780):1614–1620. doi: 10.1126/science.1124309. - DOI - PubMed
    1. Kelley JL, Swanson WJ. Positive selection in the human genome: from genome scans to biological significance. Annu Rev Genomics Hum Genet. 2008;9:143–160. doi: 10.1146/annurev.genom.9.081307.164411. - DOI - PubMed

Publication types

LinkOut - more resources