Review
. 2010 Jul 28;168(4):1019-35.
doi: 10.1016/j.neuroscience.2010.01.037. Epub 2010 Jan 28.

Aquaporins in spinal cord injury: the janus face of aquaporin 4

Affiliations
Review

Aquaporins in spinal cord injury: the janus face of aquaporin 4

O Nesic et al. Neuroscience. .

Abstract

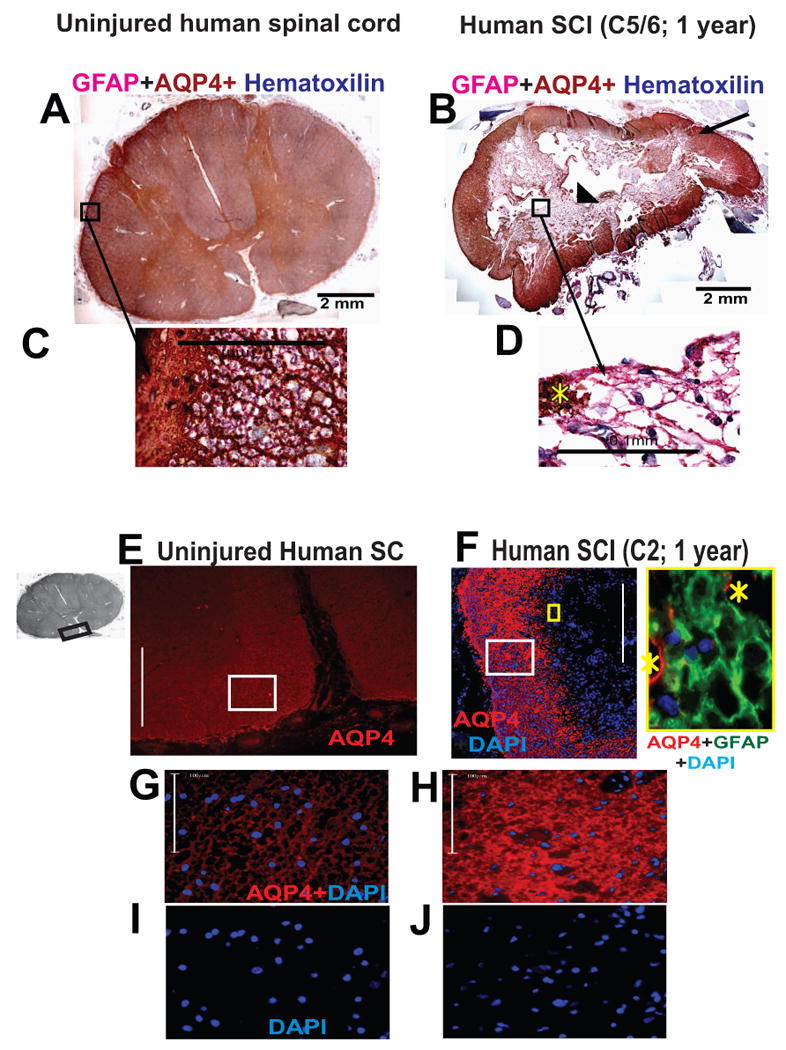
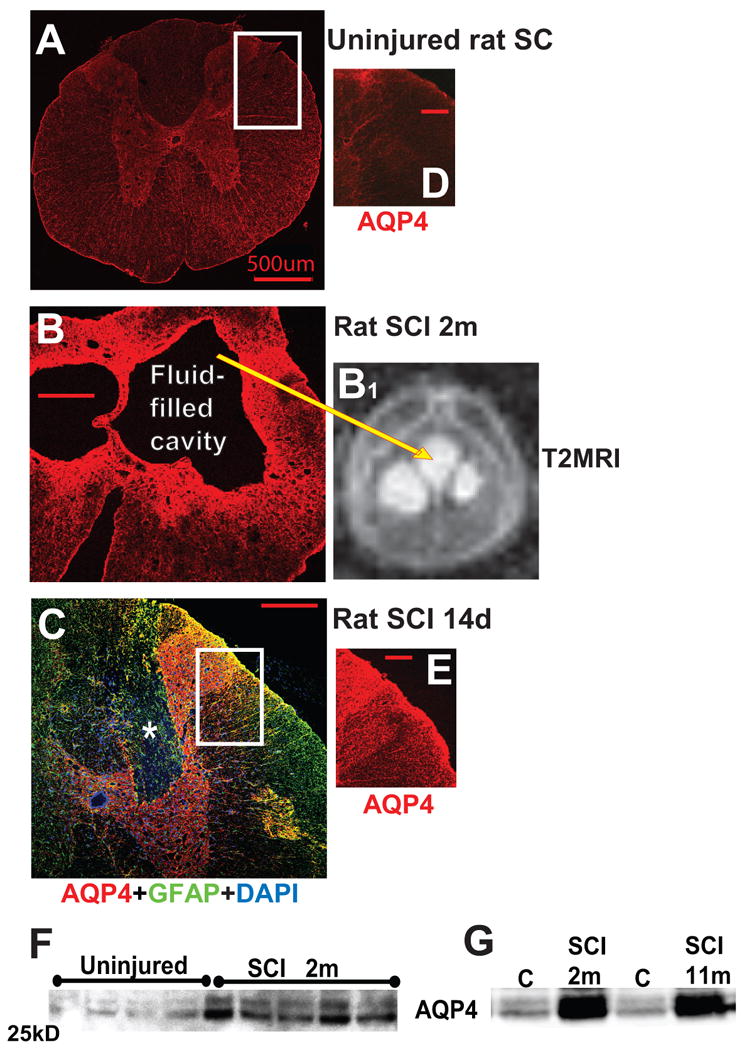
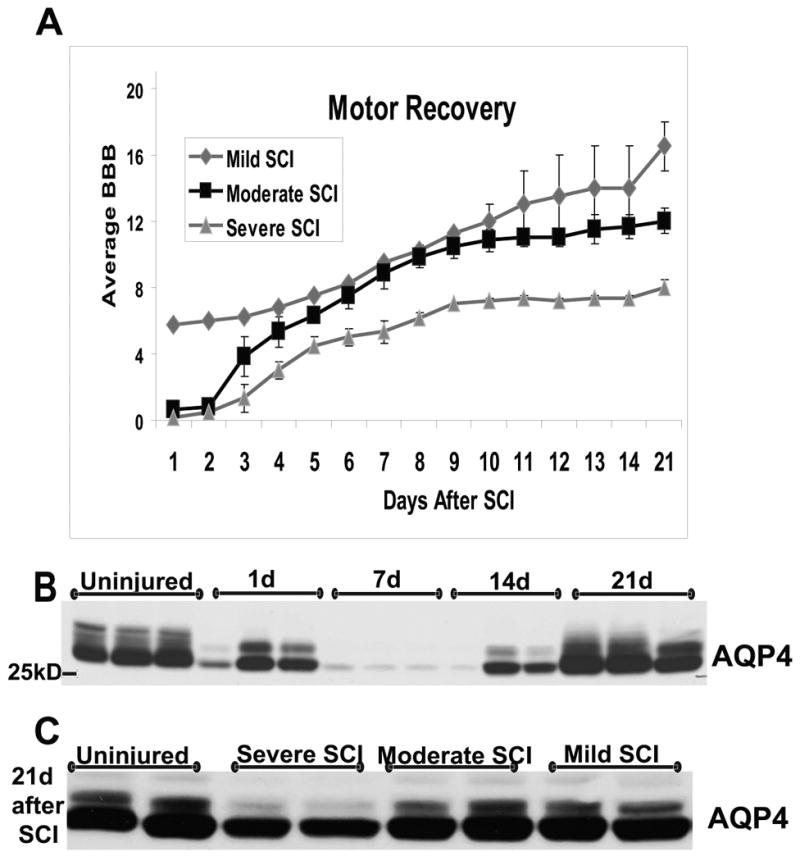
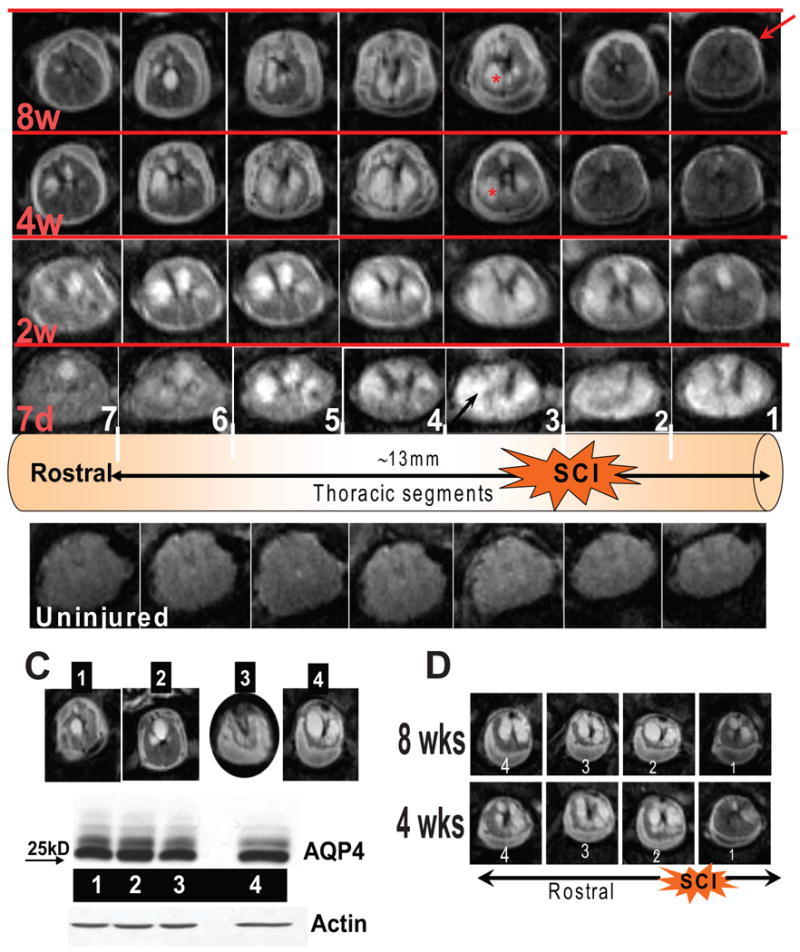
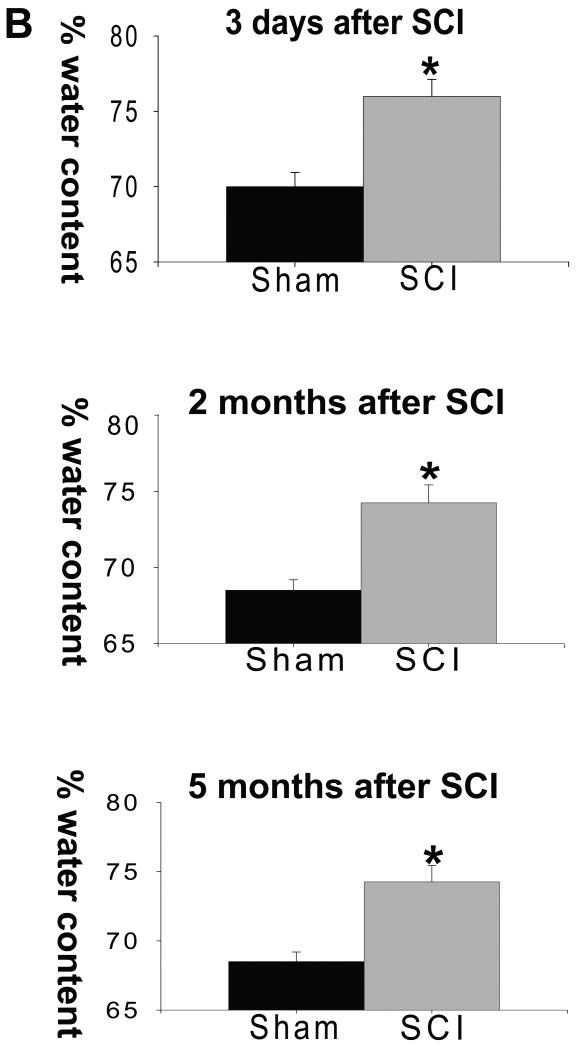
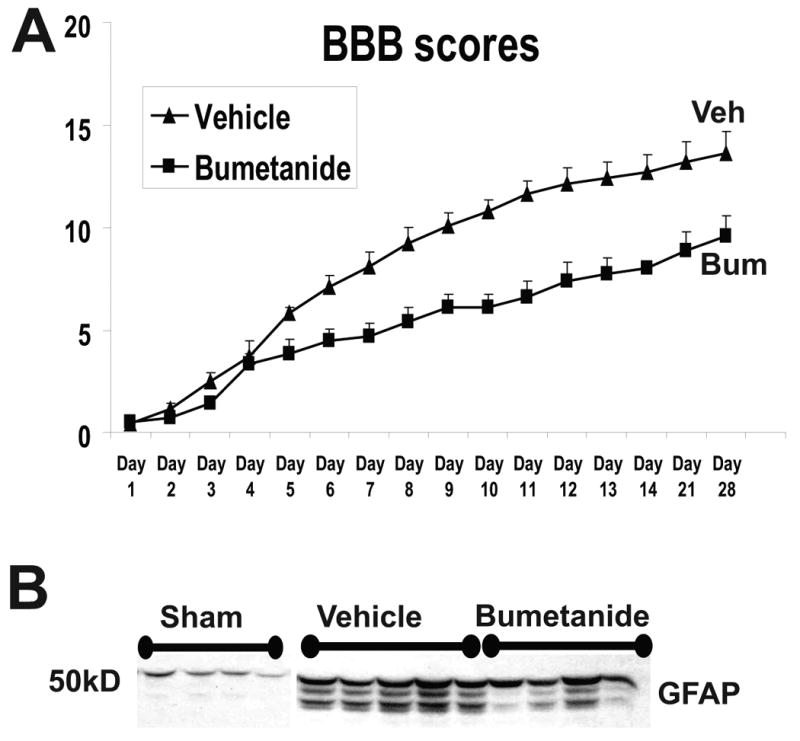
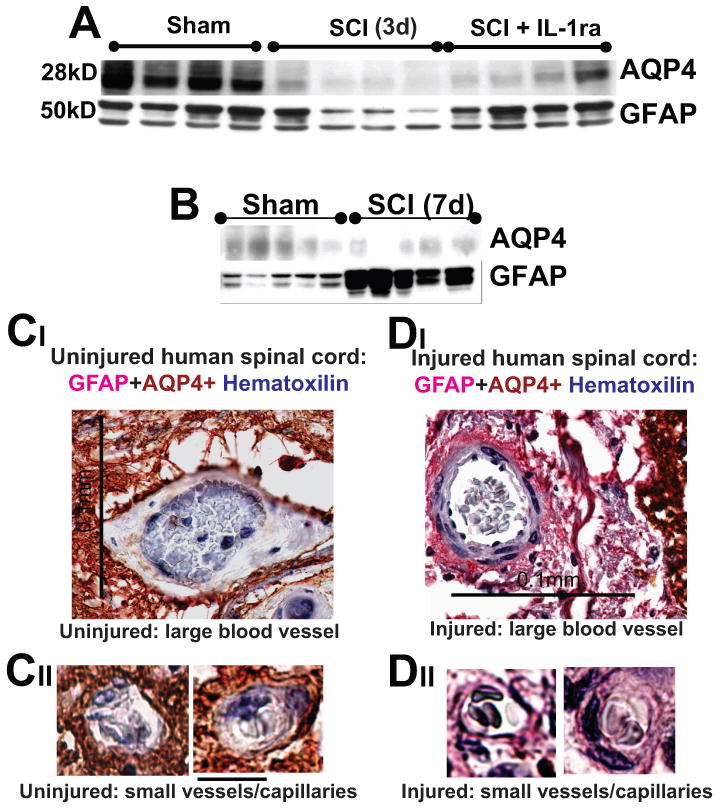
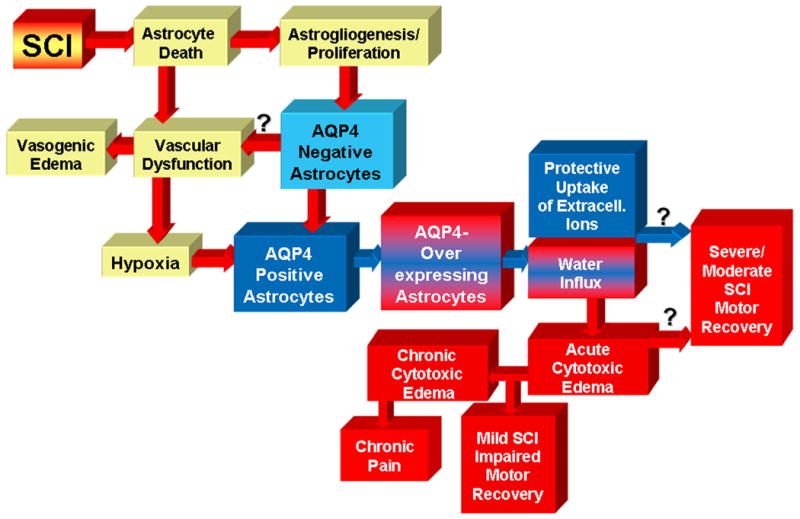
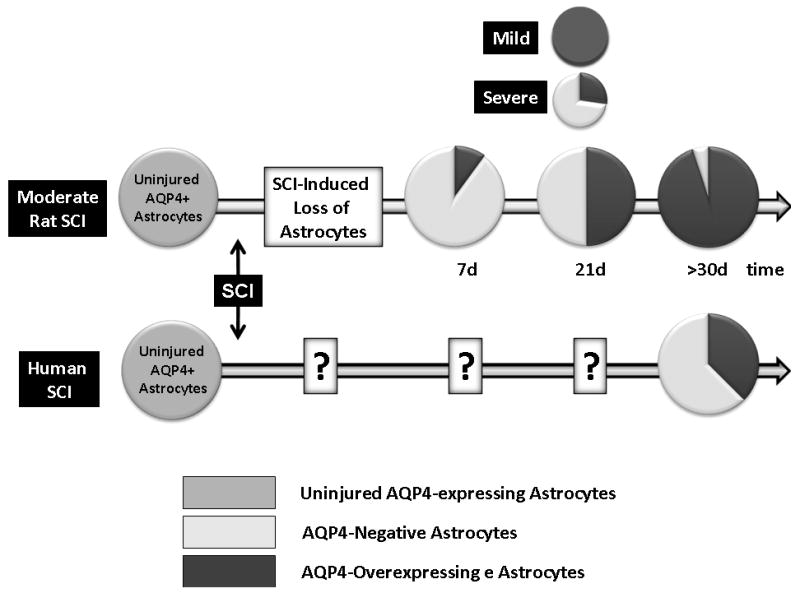
Although malfunction of spinal cord water channels (aquaporins, AQP) likely contributes to severe disturbances in ion/water homeostasis after spinal cord injury (SCI), their roles are still poorly understood. Here we report and discuss the potential significance of changes in the AQP4 expression in human SCI that generates glial fibrillary acidic protein (GFAP)-labeled astrocytes devoid of AQP4, and GFAP-labeled astroglia that overexpress AQP4. We used a rat model of contusion SCI to study observed changes in human SCI. AQP4-negative astrocytes are likely generated during the process of SCI-induced replacement of lost astrocytes, but their origin and role in SCI remains to be investigated. We found that AQP4-overexpression is likely triggered by hypoxia. Our transcriptional profiling of injured rat cords suggests that elevated AQP4-mediated water influx accompanies increased uptake of chloride and potassium ions which represents a protective astrocytic reaction to hypoxia. However, unbalanced water intake also results in astrocytic swelling that can contribute to motor impairment, but likely only in milder injuries. In severe rat SCI, a low abundance of AQP4-overexpressing astrocytes was found during the motor recovery phase. Our results suggest that severe rat contusion SCI is a better model to analyze AQP4 functions after SCI. We found that AQP4 increases in the chronic post-injury phase are associated with the development of pain-like behavior in SCI rats, while possible mechanisms underlying pain development may involve astrocytic swelling-induced glutamate release. In contrast, the formation and size of fluid-filled cavities occurring later after SCI does not appear to be affected by the extent of increased AQP4 levels. Therefore, the effect of therapeutic interventions targeting AQP4 will depend not only on the time interval after SCI or animal models, but also on the balance between protective role of increased AQP4 in hypoxia and deleterious effects of ongoing astrocytic swelling.


Figures

Fig. 1
Fig. 1
An immunohistochemical procedure was used to detect GFAP and AQP4 in human spinal cord sections. GFAP was detected with an alkaline phosphatase secondary detection system and a substrate that gave a pink precipitate from fast red chromogen. AQP4 was detected with LSAB2 system-horse radish peroxidase and DAB substrate that gave a brown end-product at the site of the target antigen. Counterstaining to detect nuclei was performed with Harris hematoxylin (dark blue). A) Uninjured human spinal cord section labeled with GFAP (red) and AQP4 (brown). Here we present cervical spinal cord section, but the same AQP4 expression pattern was found in thoracic and lumbar sections. B) Injured human spinal cord at the epicenter (C7), isolated from an SCI patient, one year after SCI. This case (No. 29) is described in Guest et al., 2005. C) Large magnification of astrocytes in the region of glia limitans externa (marked with white star) of uninjured cord clearly showing GFAP and AQP4 co-expression. Yellow star marks “islands” of AQP4 labeling among AQP4-negative astrocytes. Calibration line: 100 μm. D) GFAP-labeled astrocytes (pink) around the cyst were devoid of AQP4. Calibration line: 100 μm. E) Immunofluoresecent detection of AQP4 (red) in ventral white matter of the uninjured spinal cords; the region of the spinal cord used in this image is marked with a black rectangle in the gray image of the whole section (insert on the left). Calibration line: 400 μm. F) Equivalent AQP4 labeling in the white mater rim in C2, one year after SCI (Patient No. 28; Guest et al., 2005) showed both AQP4-devoid region at the center of the section and visibly more AQP4 labeling compared to uninjured white or gray matter human spinal cords. Calibration line: 400 μm. The insert framed in yellow depicts high magnification image of astrocytes (GFAP labeled green) devoid of AQP4 (yellow square in the low magnification image). Yellow starts mark AQP4 labeling (red). G) High magnification images of the region marked by the white rectangle in E. Calibration line: 100 μm. H) High magnification images of the region marked by the white rectangle in F. Calibration line: 100 μm. I) Nuclear counterstain (DAPI) in the same image (shown in G). J) Nuclear counterstain (DAPI) in the same image (shown in H).
Fig. 2
Fig. 2
A) Immunofluorescent AQP4 labeling in the thoracic region of an uninjured rat spinal cord. Calibration line: 500 μm. B) AQP4 labeling at the lesion site (T10) of a chronically injured rat spinal cord (2 months after SCI) with large fluid-filled cavity. Calibration line: 200 μm. B1) Fluid accumulated within cavity is visible in T2 MRI image as white, hyperintense signal (see explanation in Fig. 4) in the same injured rat cord used for AQP4 immunolabeling in B. C) AQP4 (red) and GFAP (green) labeling of astrocytes in injured rat spinal cord segment (lesion site; T10) 14d after SCI, showing injury site (dorsal horns and dorsal columns) where GFAP-labeled astrocytes devoid of AQP4 were found (marked with white star). D, E) Comparison of AQP4 in equivalent imaged regions of uninjured (A) and injured (C) spinal cords, marked with white rectangles showing substantially more AQP4 labeling in injured cords where GFAP-labeled astrocytes were also AQP4-positive, indicating AQP4 overexpression in those astroglia. Calibration line: 200 μm. F) AQP4 Western blot of four uninjured and five injured samples 2months after SCI. As expected, the blot showed two clearly identifiable AQP4 bands (M1 and M23), with the M23 isoform being more abundant. Quantitative analysis of both bands before and after SCI and at different time points consistently showed that SCI induced similar increases in both isoforms in SCI rats (n=17 for uninjured and n=28 fro SCI rats). G) A representative Western blot of two uninjured samples (C) 2 and 11 months after sham treatment, and two SCI samples (at the lesion site) 2 and 11 months after SCI showed significant increases in AQP4 levels persisting up to 11 months after SCI (the last time point measured) without decline in the intensity of either M23 or M1, suggesting permanent upregulation of AQP4 in chronically injured rat spinal cords at the lesion site.
Fig. 3
Fig. 3
A) Motor recovery of SCI (n=9) with different severities of initial contusion injury to T10. Mild injuries did not produce immediate and complete paralysis of their hindlimbs (BBB scores were >0), in contrast to moderate or severe SCI. Motor recovery was assessed using the BBB scoring system up to 21d after SCI, when motor recovery is typically finalized in severe or moderate injury. At 21d, SCI rats were sacrificed and the lesion site used for Western blot analysis. Maintaining severely injured rats for longer than 21d poses a problem, because those SCI rats develop severe pain-like behavior in chronically post-injury phase. B) Time course of AQP4 protein level changes in moderate SCI at the lesion site (T10). A representative AQP4 Western blot shows decreases in AQP4 levels at 1, 3 and 14d after SCI (n=3 per time point), and restoration of AQP4 to basal levels by 21d post-SCI. C) AQP4 Western blot (T10, 21d after SCI) in SCI rats with different levels of injury (A) showed that restoration of AQP4 levels happened in mild and moderate SCI, but not in severe, where AQP4 levels remained reduced.
Fig. 4
Fig. 4
A) The bottom line represents typical T2-MRI images of an uninjured spinal cord imaged in the same thoracic regions as those in the upper rows. Here we show 7 consecutive mages, around the SCI epicenter (images 1-3, right to left). The schematic representation above the uninjured cord shows the epicenter of SCI, and the approximate length of the cord that was imaged and presented here. The upper rows represent a moderately injured rat spinal cord imaged at 7 days, 2 wks, 4 wks and 8 wks after SCI. Numbers in white indicate individual images in columns, and red letters are time points after SCI (in rows). Arrows and asterisks are explained in the text. B) Increased water content was found not only at 3d after SCI (due to vasogenic edema) but also in the thoracic region of injured spinal cords 2 and 5months after SCI (∼20mm long; mean±S.D; p<0.05; reported in Nesic et al., 2006). C) MRI images of four SCI rats (1-4) 8 wks after SCI at the epicenter of SCI. Rat No. 4 had the largest cyst. D) Four T2 MRI images of an SCI rat whose cysts spanned ∼12 mm (about 4 segments) and enlarged from 4wks to 8 wks.
Fig. 4
Fig. 4
A) The bottom line represents typical T2-MRI images of an uninjured spinal cord imaged in the same thoracic regions as those in the upper rows. Here we show 7 consecutive mages, around the SCI epicenter (images 1-3, right to left). The schematic representation above the uninjured cord shows the epicenter of SCI, and the approximate length of the cord that was imaged and presented here. The upper rows represent a moderately injured rat spinal cord imaged at 7 days, 2 wks, 4 wks and 8 wks after SCI. Numbers in white indicate individual images in columns, and red letters are time points after SCI (in rows). Arrows and asterisks are explained in the text. B) Increased water content was found not only at 3d after SCI (due to vasogenic edema) but also in the thoracic region of injured spinal cords 2 and 5months after SCI (∼20mm long; mean±S.D; p<0.05; reported in Nesic et al., 2006). C) MRI images of four SCI rats (1-4) 8 wks after SCI at the epicenter of SCI. Rat No. 4 had the largest cyst. D) Four T2 MRI images of an SCI rat whose cysts spanned ∼12 mm (about 4 segments) and enlarged from 4wks to 8 wks.
Fig. 5
Fig. 5
A) Motor recovery (BBB test) was assessed in two groups of SCI rats; a group that received vehicle (n=5) and the other bumetanide (0.1mM; n=5) for 4 weeks continuously via osmotic minipumps (Alzet minipump, 2.5 microl/h. Catheterization and intrathecal delivery is described in Nesic et al., 2008). Vehicle or bumetanide (SIGMA #B3023) were delivered intrathecally to avoid systemic effects of NKCC1 inhibition. Concentration of bumetanide was based on Willis et al., 2006. Values are presented as Mean+/-SE. The difference between BBB scores in vehicle-treated and bumetanide-treated SCI rats was significant from day 6 till day 28 post-SCI (p<0.05; ANOVA). B) GFAP Western blot was performed after the completion of the experiment described in A). GFAP levels were measured at the site of lesion (T10), where GFAP levels are significantly increased after SCI. However, bumetanide treatment reduced GFAP levels, consistent with its inhibitory effect on astrocytic swelling.
Fig. 6
Fig. 6
A) AQP4 and GFAP Western blots 3d after SCI at the lesion site (T10). IL1ra (750ng/ml) was administered intrathecally for 3d in a group of SCI rats (n=5), while a second group of SCI rats received vehicle intrathecally for 7d (n=4). Rats were sacrificed at 3d post-SCI and Western blots performed. IL1ra was administered via osmotic minipumps and i.th. cathaters. We have also shown that IL1ra exerted expected effects: it significantly decreased Cox-2 upregulation after SCI, or reduced IL-6 mRNAs (not shown; both Cox-2 and IL-6 are known IL-1 transcriptional targets – Touzani et al., 1999; Igwe et al., 2001). Therefore, the IL-1ra effects we observed in injured cords were mediated via specific blocking of IL-1R activation. B) AQP4 and GFAP Western blots showed that 7d after SCI, AQP4 levels were still reduced at the lesion site in moderate SCI, while GFAP levels showed significantly increased levels compared to sham-treated rats (n=5 per group), indicating replacement and activation of astrocytes early after SCI (already reported in Nesic et al., 2006). C, D) Large and small blood vessels in uninjured and injured human spinal cord (C2, 1 year after SCI, SCI patient No. 29; Guest et al., 2005). Calibration line in CI :0.1 mm; and in CIII: 10 μm. GFAP-labeled astrocytic processes devoid of AQP4 (pink) surrounded blood vessel in chronically injured cords. Erythrocytes in blood vessel were stained blue with hematoxilline.
Fig. 7
Fig. 7
Described in the text.
Fig. 7
Fig. 7
Described in the text.

Similar articles

Cited by

References

    1. Abdullaev IF, Rudkouskaya A, Schools GP, Kimelberg HK, Mongin AA. Pharmacological comparison of swelling-activated excitatory amino acid release and Cl- currents in cultured rat astrocytes. J Physiol. 2006 May 1;572(Pt 3):677–89. - PMC - PubMed
    1. Amiry-Moghaddam M, Otsuka T, Hurn PD, Traystman RJ, Haug FM, Froehner SC, Adams ME, Neely JD, Agre P, Ottersen OP, Bhardwaj A. An alpha-syntrophin-dependent pool of AQP4 in astroglial end-feet confers bidirectional water flow between blood and brain. Proc Natl Acad Sci U S A. 2003 Feb 18;100(4):2106–11. - PMC - PubMed
    1. Backe HA, Betz RR, Mesgarzadeh M, Beck T, Clancy M. Post-traumatic spinal cord cysts evaluated by magnetic resonance imaging. Paraplegia. 1991;29:607–612. - PubMed
    1. Badaut J. Aquaglyceroporin 9 in brain pathologies. Neuroscience. 2009 - PubMed
    1. Barry D, McDermott K. Differentiation of radial glia from radial precursor cells and transformation into astrocytes in the developing rat spinal cord. Glia. 2005 May;50(3):187–97. - PubMed

Publication types