. 2010 Jun;170(3):540-7.
doi: 10.1016/j.jsb.2010.01.011. Epub 2010 Jan 28.

Structure of a human multidrug transporter in an inward-facing conformation

Affiliations

Structure of a human multidrug transporter in an inward-facing conformation

Mark F Rosenberg et al. J Struct Biol. 2010 Jun.

Abstract

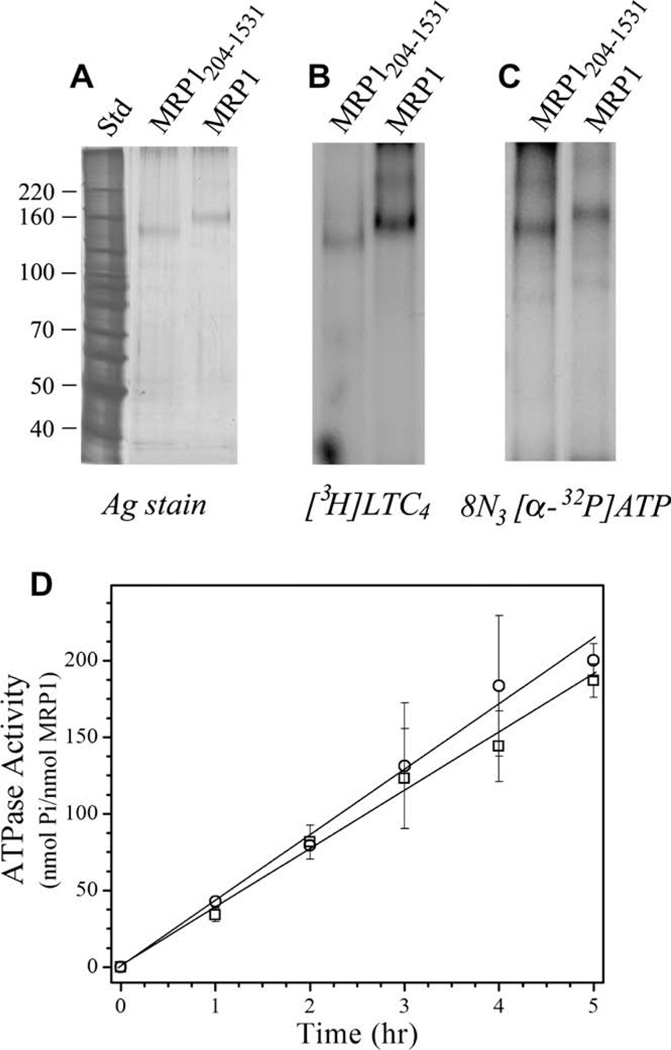
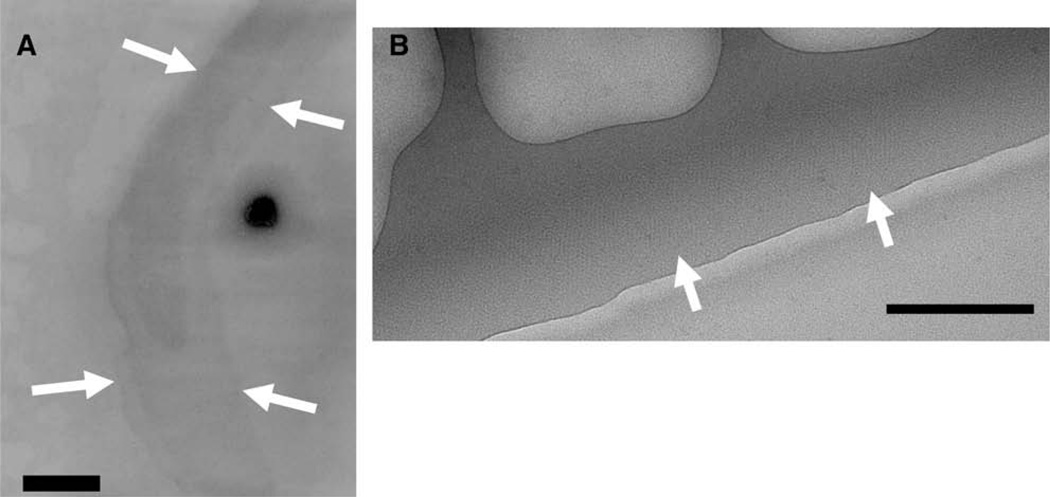
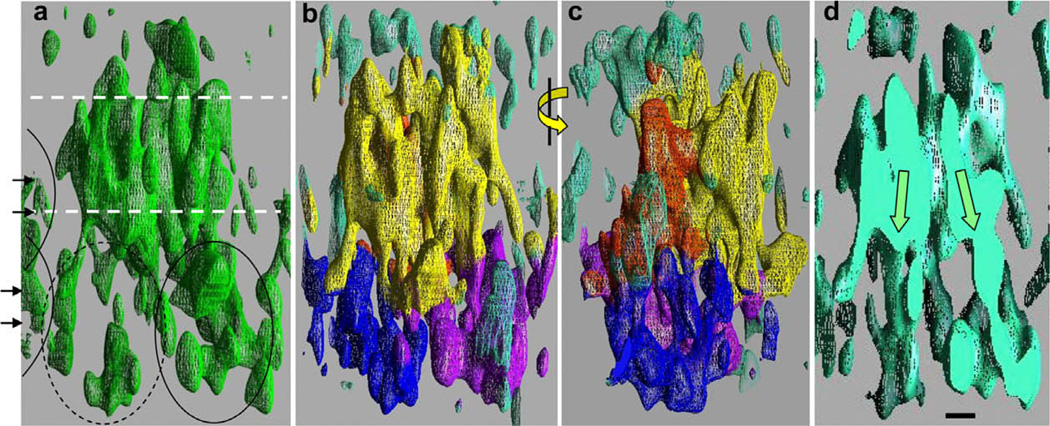
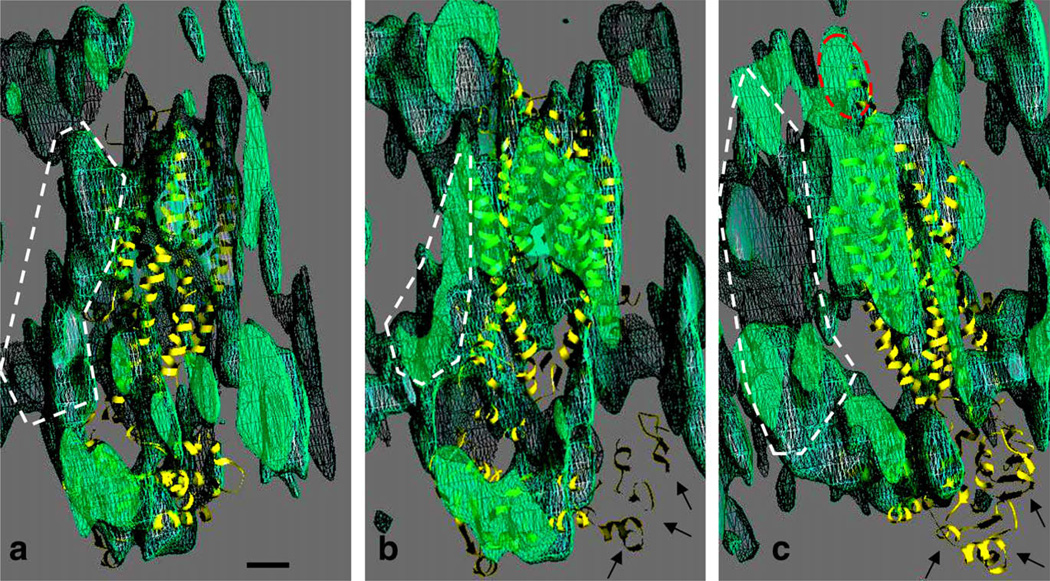
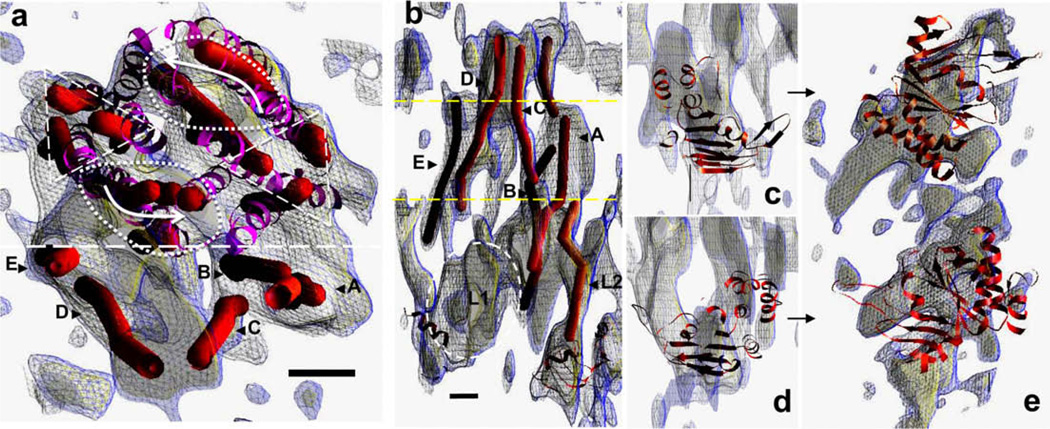
Multidrug resistance protein 1 (ABCC1) is a member of the 'C' class of ATP-binding cassette transporters, which can give rise to resistance to chemotherapy via drug export from cells. It also acts as a leukotriene C4 transporter, and hence has a role in adaptive immune response. Most C-class members have an additional NH(2)-terminal transmembrane domain versus other ATP-binding cassette transporters, but little is known about the structure and role of this domain. Using electron cryomicroscopy of 2D crystals, data at 1/6per A(-1) resolution was generated for the full-length ABCC1 protein in the absence of ATP. Analysis using homologous structures from bacteria and mammals allowed the core transmembrane domains to be localised in the map. These display an inward-facing conformation and there is a noteworthy separation of the cytoplasmic nucleotide-binding domains. Examination of non-core features in the map suggests that the additional NH(2)-terminal domain has extensive contacts on one side of both core domains, and mirrors their inward-facing configuration in the absence of nucleotide.


Figures

Figure 1
Figure 1
Properties of purified recombinant MRP1 and MRP1204–1531. expressed in P. pastoris. (A) Purified MRP1 (35 ng) and ‘short’ MRP1204–1531 (28 ng) were resolved by SDS–PAGE and silver stained. Molecular weight markers are shown on the left. (B) Purified MRP1 (1.4 µg) and MRP1204–1531 (0.8 µg) were incubated with 8-azido[α-32P]ATP (2.3 µCi; 5 µM), irradiated at 302 nm, and then resolved by SDS–PAGE and processed for autoradiography. (C) Purified MRP1 (1.5 µg) and MRP1204–1531 (0.9 µg) were incubated with [3H]LTC4 (200 nM; 0.13 µCi), irradiated at 302 nm, and then resolved by SDS–PAGE and processed for autoradiography. (D) MRP1 (0.49 µg) (○) and MRP1204–1531 (0.42 µg) (□) were assayed for ATPase activity over a 5 h time period. Values obtained were corrected for ATP hydrolysis in the absence of protein. Each point represents the mean (±SD) of four determinations.
Figure 2
Figure 2
Two-dimensional (2-D) crystals of MRP1. (A) Electron micrograph of an MRP1 crystal embedded in negative stain (2% w/v uranyl-acetate) and recorded at low-magnification (3500×). The edge of the crystal is indicated by the white arrows. The characteristic outline of these crystal areas was used to identify the crystals at low magnification (see Methods). Scale bar = 200 nm. (B) Electron micrograph of part of a MRP1 2D crystal embedded in ice. The edge of the crystal is shown by the white arrows. Scale bar = 100 nm.
Figure 3
Figure 3
The MRP1 3D density map. (a) A view along the crystal plane, showing high density regions of the map (green mesh). Molecules in adjacent unit cells encroach at the extreme left (arrowheads, arcs). A region about 50 Å thick, consistent with the TMDs is indicated by the white dashed lines. Weaker density is displayed in the ~60 Å thick cytoplasmic region (bottom) and the ~15 Å thick extracellular region (top). Density for one of the presumed NBDs (right, ellipse) is stronger than for the other (left, dashed ellipse). (b) Similar view of the density map, but with a lower density threshold for the mesh. The map has been coloured according to the interpretation described in the main text, with yellow for TMDs 1 and 2, orange for TMD0, blue and purple for the two NBDs and turquoise for unassigned regions. (c) As for panel (b), but after a 90° rotation about the vertical axis as indicated. (d) Central slice through the map, viewed from the same orientation as in panels a and b. The two halves of the protein appear to lean inwards in an inverted ‘V’ shape, giving an inward-facing conformation to the TMDs of the transporter. The scale bar corresponds to 1 nm and applies to all panels. (For interpretation of the references to colour in this figure legend, the reader is referred to the web version of this article.)
Figure 4
Figure 4
Comparison of the MRP1 map with the P-gp structural model (yellow ribbon trace). Three sequential slices through the MRP1 map (green netting) are displayed in the same orientation as in panel c of Figure 3. (a) Nearmost slice with the C-terminal half of P-gp. (b) Central slice. (c) Rearmost slice, with the N-terminal half of P-gp. Regions to the left in panels a–c, shown by the white dashed lines, were interpreted as corresponding to the additional TMD0 in MRP1. The fitting of the P-gp model to the MRP1 map (see main text for methodology) places its first NBD in a region of low density (arrows, panels b and c). The scale bar corresponds to 1 nm. (For interpretation of the references to colour in this figure legend, the reader is referred to the web version of this article.)
Figure 5
Figure 5
Further interpretation of the MRP1 map. (a) Manual tracing of the paths (red cylinders) of cylindrical regions of continuous density in the MRP1 map (blue mesh at 0.9σ, yellow mesh at 1.25σ), using a slab of the high density region viewed from the expected extracellular side of the protein. The location of the fitted P-gp structure within the map is also displayed (purple ribbon trace), as well as local clusters of cylinders that are roughly related by a local twofold symmetry in terms of position (triangular and oval dashed outlines) as well as tilt (curved arrows). On one side of the region (separated by the dashed line) lie cylindrical densities (A–E) that are not matched by the P-gp structure, and may be part of TMD0. A side view of this region is displayed in panel b, with an estimate of the boundaries of the lipid bilayer (yellow dashed lines). Some of the cylindrical densities extend up into the extracellular region at the top (C,D), whilst some (A,B) extend downwards. A sixth cylindrical path (L2) extends down towards a region occupied by the C-terminal NBD of the fitted P-gp structure, whilst a lozenge-shaped region of density (L1, dashed ellipse) extends towards the opposite NBD. Individual fitting of the MetNI NBDs is shown in the relevant sections of the MRP1 map (panels c–e), as viewed from the same orientation as in Fig. 4 (panels c and d), or as viewed from the cytoplasmic side of the protein (panel e). Scale bars = 1 nm, panels b–e are at the same scale. (For interpretation of the references to colour in this figure legend, the reader is referred to the web version of this article.)

Similar articles

Cited by

References

    1. Aller SG, Yu J, Ward A, Weng Y, Chittaboina S, Zhuo R, Harrell PM, Trinh YT, Zhang Q, Urbatsch IL, Chang G. Structure of P-glycoprotein reveals a molecular basis for poly-specific drug binding. Science. 2009;323:1718–1722. - PMC - PubMed
    1. Auer M, Scarborough GA, Kuhlbrandt W. Three-dimensional map of the plasma membrane H+-ATPase in the open conformation. Nature. 1998;392:840–843. - PubMed
    1. Auer M, Scarborough GA, Kuhlbrandt W. Surface crystallisation of the plasma membrane H+-ATPase on a carbon support film for electron crystallography. J. Mol. Biol. 1999;287:961–968. - PubMed
    1. Awayn NH, Rosenberg MF, Kamis AB, Aleksandrov LA, Riordan JR, Ford RC. Crystallographic and single-particle analyses of native and nucleotide-bound forms of the cystic fibrosis transmembrane conductance regulator (CFTR) protein. Biochem. Soc. Trans. 2005;33:996–999. - PubMed
    1. Bakos E, Hegedus T, Hollo Z, Welker E, Tusnady GE, Zaman GJR, Flens MJ, Varadi A, Sarkadi B. Membrane topology and glycosylation of the human multidrug resistance-associated protein. J. Biol. Chem. 1996;271:12322–12326. - PubMed

Publication types

MeSH terms

Substances