

Autoantibody profiles in two patients with non-autoimmune muscle disease implicate a role for gliadin autoreactivity
- PMID: 20110170
- PMCID: PMC2841214
- DOI: 10.1016/j.nmd.2009.12.008
Autoantibody profiles in two patients with non-autoimmune muscle disease implicate a role for gliadin autoreactivity
Abstract
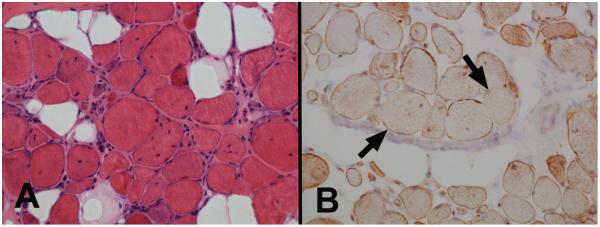
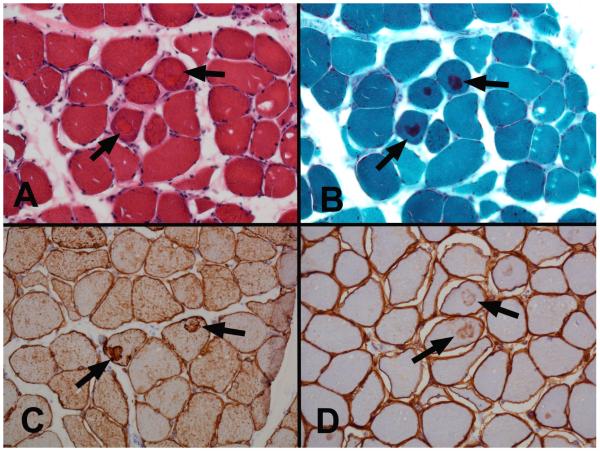
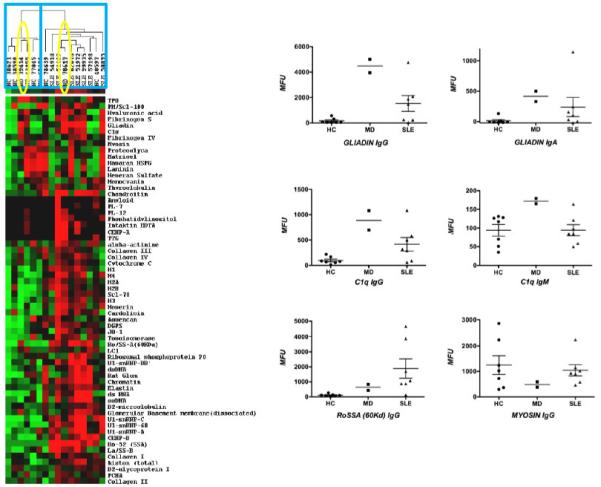
The objective of this case study was to characterize autoreactivity in two patients with non-autoimmune forms of muscle disease who had positivity for antinuclear antibodies (ANA) and Ro (SSA) autoantibodies. Serum samples from these two patients were applied to an autoantigen protein array with more than 70 specificities and were compared to samples from healthy controls and patients with systemic lupus erythematosus. Both myopathy patients had high levels of gliadin autoreactivity in serum and one patient had an overall autoantibody profile with lupus-like features. The findings suggest that some disorders of muscle that are considered non-autoimmune, may in fact have autoimmune features. Further examination of the role of subclinical gluten autoreactivity in the pathogenesis of myopathy syndromes has the potential to suggest improved approaches to diagnosis and treatment of these conditions.
Copyright 2010 Elsevier B.V. All rights reserved.
Figures
Similar articles
-
Risk factors for ANA positivity in healthy persons.Arthritis Res Ther. 2011 Mar 2;13(2):R38. doi: 10.1186/ar3271. Arthritis Res Ther. 2011. PMID: 21366908 Free PMC article.
-
[Investigation of the Contribution of Autoantibodies to Clinical Diagnosis in Liver Pathologies and the Identification of Accompanying Autoimmune Diseases].Mikrobiyol Bul. 2022 Jan;56(1):81-94. doi: 10.5578/mb.20229907. Mikrobiyol Bul. 2022. PMID: 35088962 Turkish.
-
Autoantibodies predate the onset of systemic lupus erythematosus in northern Sweden.Arthritis Res Ther. 2011 Feb 22;13(1):R30. doi: 10.1186/ar3258. Arthritis Res Ther. 2011. PMID: 21342502 Free PMC article.
-
Autoimmune myopathies: autoantibodies, phenotypes and pathogenesis.Nat Rev Neurol. 2011 Jun 8;7(6):343-54. doi: 10.1038/nrneurol.2011.63. Nat Rev Neurol. 2011. PMID: 21654717 Review.
-
Autoantibodies in systemic lupus erythematosus.Ann Acad Med Singap. 1988 Apr;17(2):195-200. Ann Acad Med Singap. 1988. PMID: 3044259 Review.
Cited by
-
Risk factors for ANA positivity in healthy persons.Arthritis Res Ther. 2011 Mar 2;13(2):R38. doi: 10.1186/ar3271. Arthritis Res Ther. 2011. PMID: 21366908 Free PMC article.
-
The uses and misuses of multiplex autoantibody assays in systemic autoimmune rheumatic diseases.Front Immunol. 2015 Apr 21;6:181. doi: 10.3389/fimmu.2015.00181. eCollection 2015. Front Immunol. 2015. PMID: 25954274 Free PMC article. Review. No abstract available.
-
Role of Immunoglobulins in Muscular Dystrophies and Inflammatory Myopathies.Front Immunol. 2021 Jul 14;12:666879. doi: 10.3389/fimmu.2021.666879. eCollection 2021. Front Immunol. 2021. PMID: 34335568 Free PMC article. Review.
References
-
- Bohan A, Peter JB. Polymyositis and dermatomyositis (first of two parts) N.Engl.J.Med. 1975;292:344–7. - PubMed
-
- Bohan A, Peter JB. Polymyositis and dermatomyositis (second of two parts) N.Engl.J.Med. 1975;292:403–7. - PubMed
-
- Amato AA, Griggs RC. Unicorns, dragons, polymyositis, and other mythological beasts. Neurology. 2003;61:288–9. - PubMed
-
- Selcen D, Krueger BR, Engel AG. Familial cardioneuromyopathy with hyaline masses and nemaline rods: a novel phenotype. Ann.Neurol. 2002;51:224–34. - PubMed
-
- Wandstrat AE, Carr-Johnson F, Branch V, et al. Autoantibody profiling to identify individuals at risk for systemic lupus erythematosus. J.Autoimmunity. 2006;27:153–60. - PubMed
Publication types
MeSH terms
Substances
Grants and funding
LinkOut - more resources
Full Text Sources
Medical
Research Materials
