. 2010 May;38(9):2825-38.
doi: 10.1093/nar/gkq008. Epub 2010 Jan 27.

Splicing factor and exon profiling across human tissues

Affiliations

Splicing factor and exon profiling across human tissues

Pierre de la Grange et al. Nucleic Acids Res. 2010 May.

Abstract

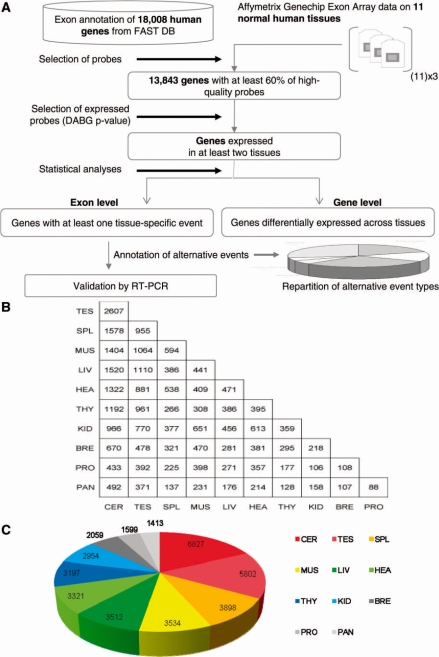
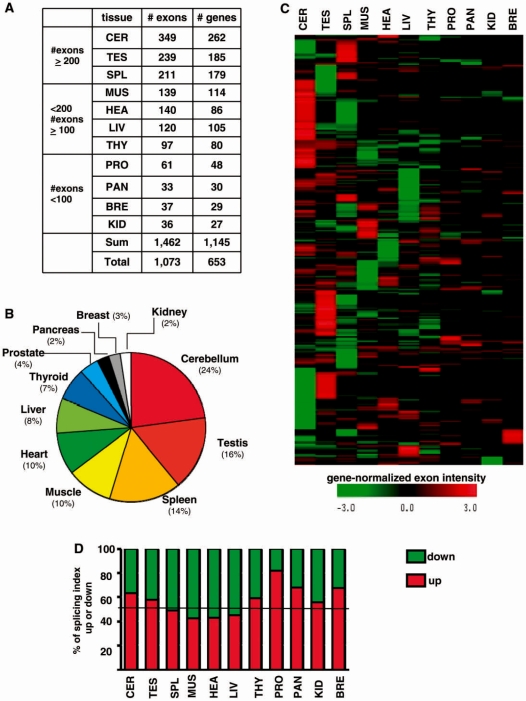
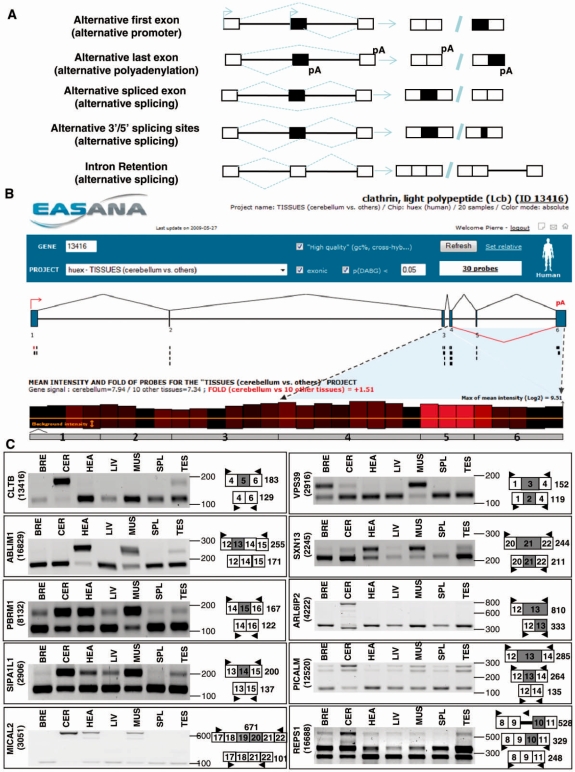
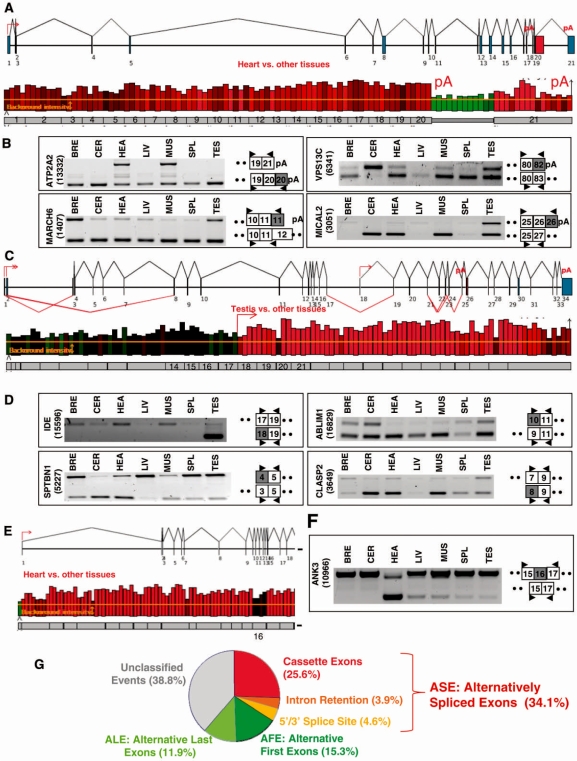
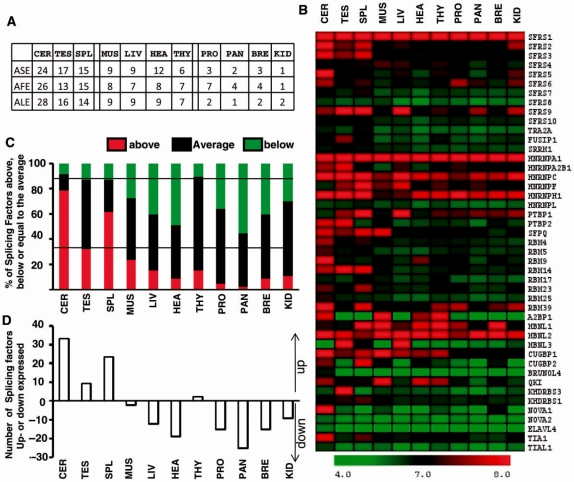
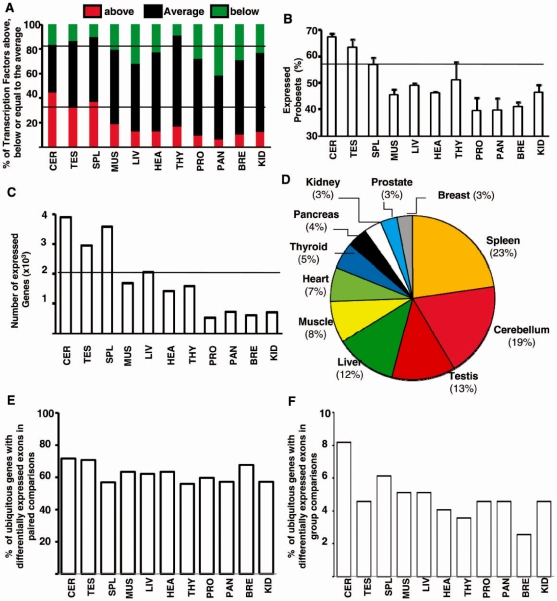
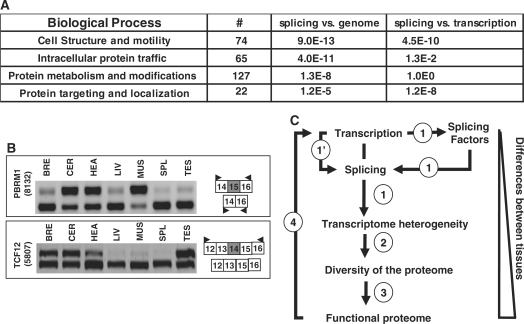
It has been shown that alternative splicing is especially prevalent in brain and testis when compared to other tissues. To test whether there is a specific propensity of these tissues to generate splicing variants, we used a single source of high-density microarray data to perform both splicing factor and exon expression profiling across 11 normal human tissues. Paired comparisons between tissues and an original exon-based statistical group analysis demonstrated after extensive RT-PCR validation that the cerebellum, testis, and spleen had the largest proportion of differentially expressed alternative exons. Variations at the exon level correlated with a larger number of splicing factors being expressed at a high level in the cerebellum, testis and spleen than in other tissues. However, this splicing factor expression profile was similar to a more global gene expression pattern as a larger number of genes had a high expression level in the cerebellum, testis and spleen. In addition to providing a unique resource on expression profiling of alternative splicing variants and splicing factors across human tissues, this study demonstrates that the higher prevalence of alternative splicing in a subset of tissues originates from the larger number of genes, including splicing factors, being expressed than in other tissues.


Figures

Figure 1.
Figure 1.
Identification of differentially expressed exons by paired comparisons. (A) Workflow. The exon and gene expression profiling across 11 normal tissues was performed using the same dataset from Affymetrix. Stringent criteria were used to select probes from genes expressed in at least two tissues in order to compare the exon content of well-expressed transcripts produced from annotated genes. Among 18 008 human genes annotated in FAST DB based on publicly available mRNA sequences, 13 843 genes were defined by >60% of high-quality probes. (B) Number of exons being differentially expressed when comparing two tissues as indicated. Fifty-five paired comparisons were performed by comparing each tissue to each other. Comparisons between two tissues were performed by considering only genes that were well expressed in both tissues. (C) Number of differentially expressed exons identified for each tissue. Each tissue contained a number of unique differentially expressed exons.
Figure 2.
Figure 2.
Identification of differentially expressed exons by group comparison. (A) Number of differentially expressed exons and number of corresponding genes identified by a group comparison. Tissue ranking was done depending on the number of differentially expressed exons associated with each tissue. (B) Proportion of differentially expressed exons identified for each tissue. The number of differentially expressed exons associated with each tissue was divided by the total number of differentially expressed exons identified by a group comparison. (C) Non-supervised hierarchical clustering of gene-normalized exon intensities. Differentially regulated exons across 11 tissues were hierarchically clustered based on their gene-normalized exon intensity. Color scale representing gene-normalized exon intensity is shown below the clustergram. (D) Proportion of ‘splicing index’ fold-changes that were up or down in the tissue group comparison. ‘Splicing index’ values corresponding to the exons identified in the statistical group comparison for each individual tissue were either up (preferentially included) or down (preferentially excluded).
Figure 3.
Figure 3.
Annotation and validation of ASEs. (A) Classification of alternative exons. Alternative exons can be classified either as AFEs, ALEs or ASEs. ASEs can be extended or shortened through the use of alternative 5′- and 3′-splice sites and introns can be spliced out or retained. (B) CLTB gene analysis. Genomic structure of the CLTB gene (upper panel). According to FAST DB exon numeration and annotation, the human CLTB gene contains 6 exons and one ASE (indicated by red lines below exon 5). Graphical representation of the exon array probes corresponding to the CLTB gene in the cerebellum compared to the other tissues (lower panel). Each Affymetrix probe corresponding to the CLTB gene is represented by a bar above the numbered grey exons of the gene. The height of each bar is proportional to the mean intensity of the corresponding probe, as calculated from three independent experiments for a given tissue (in this case, the cerebellum). In addition, the color of each bar is proportional to the differences in probe intensities between samples (in this case, cerebellum compared to the mean intensity calculated for the 10 other tissues): a red bar means that the intensity of the corresponding probe was greater in the cerebellum; black corresponds to probes with no intensity variation; and a green bar indicates that the intensity of the corresponding probe was lower in the cerebellum. The bright red bars corresponding to exon 5 indicate that exon 5 may be more included in the cerebellum than in other tissues. Screenshot is from EASANA®. (C) RT-PCR analysis. RT-PCR analyses for several ASEs predicted to be differentially expressed between tissues.
Figure 4.
Figure 4.
Annotation and validation of alternative first and last exons. (A) ATP2A2 gene analysis. Genomic structure of the ATP2A2 gene (upper panel). According to FAST DB exon numeration and annotation, the human ATP2A2 gene contains 21 exons and two potential last exons, as indicated by a pA symbol above exons 20 and 21. Graphical representation of the exon array probes corresponding to the ATP2A2 gene in the heart compared to the other tissues (lower panel). Each Affymetrix probe corresponding to the ATP2A2 gene is represented by a bar above the numbered grey exons of the gene. The bright green bars corresponding to 3′-end extended exon 20 and the red bars corresponding to exon 21 indicated that exons 20 and 21 were differentially used between heart and other tissues. Screenshot is from EASANA®. (B) RT-PCR analysis of ALEs. RT-PCR analyses for several ALEs predicted to be differentially expressed between tissues. (C) IDE gene analysis. Genomic structure of the IDE gene (upper panel). According to FAST DB exon numeration and annotation, the human IDE gene contains 34 exons and three potential first exons, as indicated by a red arrow above exons 1, 2 and 18. Graphical representation of the exon array probes corresponding to the IDE gene in the testis compared to the other tissues (lower panel). Each Affymetrix probe corresponding to the IDE gene is represented by a bar above the numbered grey exons of the gene. The bright red bars corresponding to exon 18 and downstream exons indicated that the transcripts starting with exon 18 were more expressed in the testis than in other tissues. Screenshot is from EASANA®. (D) RT-PCR analysis of AFEs. RT-PCR analyses for several AFEs predicted to be differentially expressed across tissues. (E) ANK3 gene analysis. Genomic structure of the ANK3 gene and graphical representation of the exon array probes corresponding to the ANK3 gene in the heart compared to the other tissues (upper and lower panels). Each Affymetrix probe corresponding to the ANK3 gene is represented by a bar above the numbered grey exons of the gene. The black bars corresponding to exon 16 compared to the red bars corresponding to the other exons indicate that exon 16 may be skipped in the heart. Screenshot is from EASANA®. (F) RT-PCR analysis for the ANK3 gene. The RT-PCR analyses for the ANK3 gene demonstrated that ANK3 exon 16 was more frequently skipped in the heart than in other tissues. (G) Classification of the differentially expressed exons between tissues. Sixty-one percent of the differentially expressed exons across tissues were already annotated in FAST DB as ASEs, AFEs or ALE.
Figure 5.
Figure 5.
Profile of splicing factors gene expression across 11 tissues. (A) Tissue ranking of classified and differentially expressed exons across tissues. A similar tissue ranking was obtained for ASEs, AFEs and ALE that were differentially expressed across tissues. (B) HeatMap of 45 splicing factor gene intensity. The color scale representing gene normalized intensity is shown below the HeatMap. (C) Proportion of splicing factors being up- or down-expressed in each tissue compared to their average expression level in the 11 tissues. The mean of the gene signal in the 11 tissues was calculated for each splicing factor. The distance between the gene signal in a given tissue and the corresponding mean in the 11 tissues was calculated. The number of splicing factors with a gene expression level above or below the gene expression average in the 11 tissues was calculated. (D) Number of splicing factors being up- or down-expressed in each tissue. The number of splicing factors being less expressed in a given tissue was subtracted from the number of splicing factors being more expressed in the same tissue.
Figure 6.
Figure 6.
Profile of gene expression across 11 tissues. (A) Number of transcription factors being up- or down-expressed in each tissue compared to their average expression level in the 11 tissues. The mean of the gene signal in the 11 tissues was calculated for each transcription factor. The distance between the gene signal in a given tissue and the corresponding mean in the 11 tissues was calculated. The number of transcription factors with a gene expression level above or below the gene expression average in the 11 tissues was calculated. (B) Percentage of selected probesets expressed above DABG in each tissue. (C) Number of genes expressed above DABG in each tissue. (D) Statistical group analysis of gene expression levels. The tissue ranking using gene expression level (gene signal) values in parallel to those of alternative exons (compared with Figures 2B); that is, the same types of samples with the largest number of differentially expressed exon (spleen, cerebellum and testes, see Figure 2B) were among those with the most differentially expressed genes. (E) Percentage in each tissue of genes that were significantly expressed in 11 tissues and that contained differentially expressed exons in paired comparisons. The proportion of genes with differentially expressed exons in each tissue was calculated among 524 genes (corresponding to 100%) that were significantly expressed in the 11 tissues and that were predicted to contain differentially expressed alternative exons in all paired comparisons. (F) Percentage in each tissue of genes that were significantly expressed in 11 tissues and that contained differentially expressed exons in group comparisons. The proportion of genes with differentially expressed exons in each tissue was calculated among 196 genes (corresponding to 100%) that were significantly expressed in the 11 tissues and that were predicted to contain differentially expressed alternative exons in all group comparisons.
Figure 7.
Figure 7.
Functional consequences of differential exon selection. (A) Biological process. Number of genes presenting differentially regulated exons across tissues and associated with specific biological processes as defined by PANTHER (www.pantherdb.org). Biological process analysis was performed using Bonferroni correction. Statistical significance calculated by comparing splicing-regulated genes to the genome or splicing-regulated genes to transcriptional-regulated genes. (B) RT-PCR analysis. The RT-PCR analyses for the PBRM1 and TCF12 transcriptional factors demonstrated that different spliced isoforms were differentially expressed across analyzed tissues. (C) Successive layers of regulation drive an increasing divergence between tissues. Key transcriptional regulators determine the nature and the number of genes being expressed during cell specialization. Tissues expressing a larger number of genes express a larger number of splicing factors that in turn impact the exon content of the gene products (1). Transcriptional regulators may also affect transcript exon content (1’). As a consequence, the transcriptome differs in terms of both transcript expression level and transcript exon content, resulting in a more diversified proteome (2). Outcomes of differentially expressed exons impinge on a third layer of regulation [(3), the ‘functional proteome’] as there was an enrichment of splicing-regulated genes involved in ‘intracellular protein traffic’ and ‘protein metabolism and modification’. This process may be maintained by impacting on transcriptional regulators (4).

Similar articles

Cited by

References

    1. Shyamsundar R, Kim YH, Higgins JP, Montgomery K, Jorden M, Sethuraman A, van de Rijn M, Botstein D, Brown PO, Pollack JR. A DNA microarray survey of gene expression in normal human tissues. Genome Biol. 2005;6:R22. - PMC - PubMed
    1. Saito-Hisaminato A, Katagiri T, Kakiuchi S, Nakamura T, Tsunoda T, Nakamura Y. Genome-wide profiling of gene expression in 29 normal human tissues with a cDNA microarray. DNA Res. 2002;9:35–45. - PubMed
    1. Blencowe BJ. Alternative splicing: new insights from global analyses. Cell. 2006;126:37–47. - PubMed
    1. Black DL. Mechanisms of alternative pre-messenger RNA splicing. Annu. Rev. Biochem. 2003;72:291–336. - PubMed
    1. Zavolan M, Kondo S, Schonbach C, Adachi J, Hume DA, Hayashizaki Y, Gaasterland T. Impact of alternative initiation, splicing, and termination on the diversity of the mRNA transcripts encoded by the mouse transcriptome. Genome Res. 2003;13:1290–1300. - PMC - PubMed

Publication types

Substances