

Proteomic analysis of pollination-induced corolla senescence in petunia
- PMID: 20110265
- PMCID: PMC2826652
- DOI: 10.1093/jxb/erp373
Proteomic analysis of pollination-induced corolla senescence in petunia
Abstract
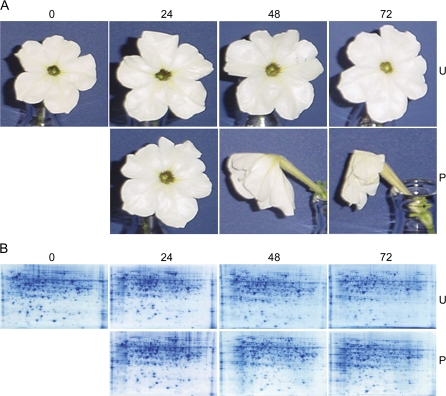
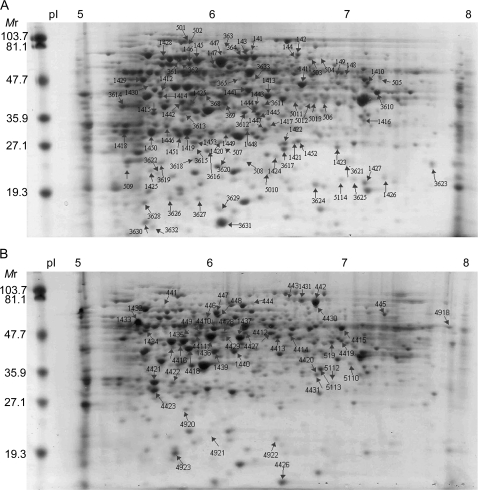
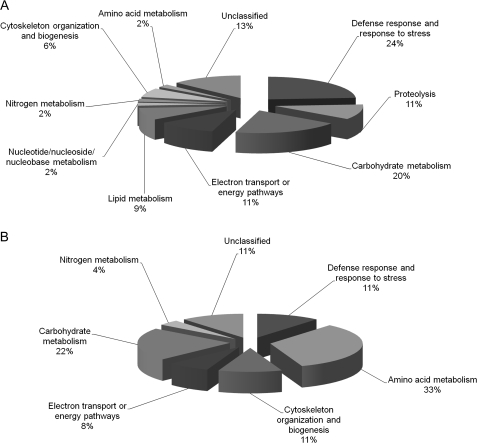
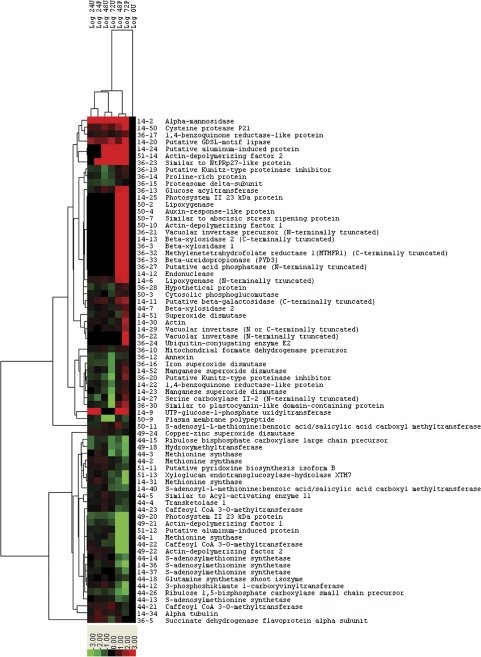
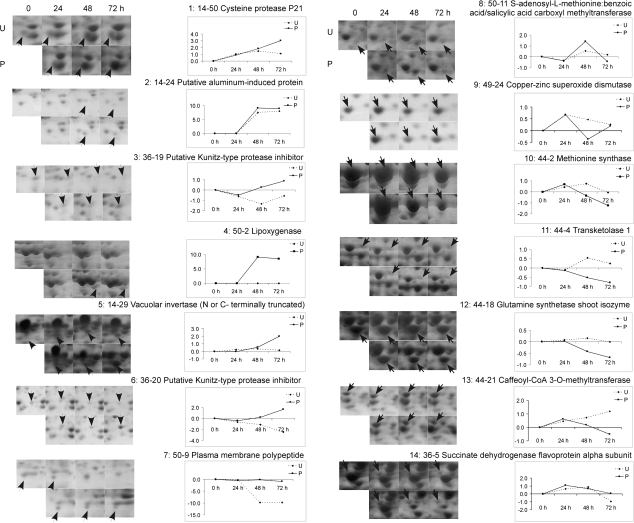
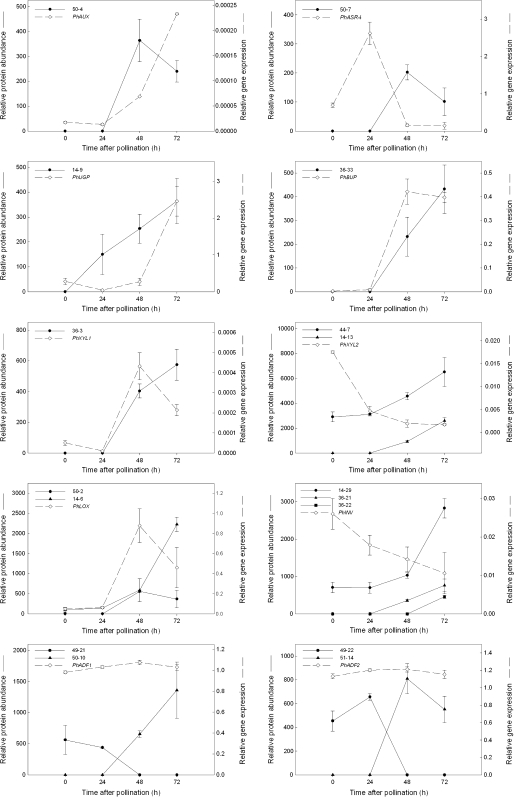
Senescence represents the last phase of petal development during which macromolecules and organelles are degraded and nutrients are recycled to developing tissues. To understand better the post-transcriptional changes regulating petal senescence, a proteomic approach was used to profile protein changes during the senescence of Petuniaxhybrida 'Mitchell Diploid' corollas. Total soluble proteins were extracted from unpollinated petunia corollas at 0, 24, 48, and 72 h after flower opening and at 24, 48, and 72 h after pollination. Two-dimensional gel electrophoresis (2-DE) was used to identify proteins that were differentially expressed in non-senescing (unpollinated) and senescing (pollinated) corollas, and image analysis was used to determine which proteins were up- or down-regulated by the experimentally determined cut-off of 2.1-fold for P <0.05. One hundred and thirty-three differentially expressed protein spots were selected for sequencing. Liquid chromatography-tandem mass spectrometry (LC-MS/MS) was used to determine the identity of these proteins. Searching translated EST databases and the NCBI non-redundant protein database, it was possible to assign a putative identification to greater than 90% of these proteins. Many of the senescence up-regulated proteins were putatively involved in defence and stress responses or macromolecule catabolism. Some proteins, not previously characterized during flower senescence, were identified, including an orthologue of the tomato abscisic acid stress ripening protein 4 (ASR4). Gene expression patterns did not always correlate with protein expression, confirming that both proteomic and genomic approaches will be required to obtain a detailed understanding of the regulation of petal senescence.
Figures
Similar articles
-
RNA-sequencing reveals early, dynamic transcriptome changes in the corollas of pollinated petunias.BMC Plant Biol. 2014 Nov 18;14:307. doi: 10.1186/s12870-014-0307-2. BMC Plant Biol. 2014. PMID: 25403317 Free PMC article.
-
Ethylene regulates phosphorus remobilization and expression of a phosphate transporter (PhPT1) during petunia corolla senescence.J Exp Bot. 2009;60(7):2179-90. doi: 10.1093/jxb/erp092. Epub 2009 Apr 20. J Exp Bot. 2009. PMID: 19380421 Free PMC article.
-
Ethylene-sensitivity regulates proteolytic activity and cysteine protease gene expression in petunia corollas.J Exp Bot. 2005 Oct;56(420):2733-44. doi: 10.1093/jxb/eri266. Epub 2005 Aug 30. J Exp Bot. 2005. PMID: 16131506
-
Regulation of volatile benzenoid biosynthesis in petunia flowers.Trends Plant Sci. 2006 Jan;11(1):20-5. doi: 10.1016/j.tplants.2005.09.009. Epub 2005 Oct 12. Trends Plant Sci. 2006. PMID: 16226052 Review.
-
Molecular understanding of postharvest flower opening and senescence.Mol Hortic. 2021 Aug 24;1(1):7. doi: 10.1186/s43897-021-00015-8. Mol Hortic. 2021. PMID: 37789453 Free PMC article. Review.
Cited by
-
The scutellum of germinated wheat grains undergoes programmed cell death: identification of an acidic nuclease involved in nucleus dismantling.J Exp Bot. 2012 Sep;63(15):5475-85. doi: 10.1093/jxb/ers199. Epub 2012 Aug 9. J Exp Bot. 2012. PMID: 22888125 Free PMC article.
-
Organisation and regulation of the cytoskeleton in plant programmed cell death.Cell Death Differ. 2011 Aug;18(8):1263-70. doi: 10.1038/cdd.2011.39. Epub 2011 May 13. Cell Death Differ. 2011. PMID: 21566662 Free PMC article. Review.
-
Proteome and Ubiquitome Changes during Rose Petal Senescence.Int J Mol Sci. 2019 Dec 4;20(24):6108. doi: 10.3390/ijms20246108. Int J Mol Sci. 2019. PMID: 31817087 Free PMC article.
-
Annexin5 plays a vital role in Arabidopsis pollen development via Ca2+-dependent membrane trafficking.PLoS One. 2014 Jul 14;9(7):e102407. doi: 10.1371/journal.pone.0102407. eCollection 2014. PLoS One. 2014. PMID: 25019283 Free PMC article.
-
Mineral nutrient remobilization during corolla senescence in ethylene-sensitive and -insensitive flowers.AoB Plants. 2013;5:plt023. doi: 10.1093/aobpla/plt023. Epub 2013 May 9. AoB Plants. 2013. PMID: 23671789 Free PMC article.
References
-
- Ashman TL, Schoen DJ. How long should flowers live. Nature. 1994;317:788–791.
-
- Ahsan N, Lee DG, Lee SH, Kang KY, Bahk JD, Choi MS, Lee IJ, Renaut J, Lee BH. A comparative proteomic analysis of tomato leaves in response to waterlogging stress. Journal of Plant Physiology. 2007;131:555–570. - PubMed
-
- Askari H, Edqvist J, Hajheidari M, Kafi M, Salekdeh GH. Effects of salinity levels on proteome of Suaeda aegyptiaca leaves. Proteomics. 2006;6:2542–2554. - PubMed
Publication types
MeSH terms
LinkOut - more resources
Full Text Sources
Research Materials
