

Poleward transport of TPX2 in the mammalian mitotic spindle requires dynein, Eg5, and microtubule flux
- PMID: 20110350
- PMCID: PMC2836978
- DOI: 10.1091/mbc.e09-07-0601
Poleward transport of TPX2 in the mammalian mitotic spindle requires dynein, Eg5, and microtubule flux
Abstract
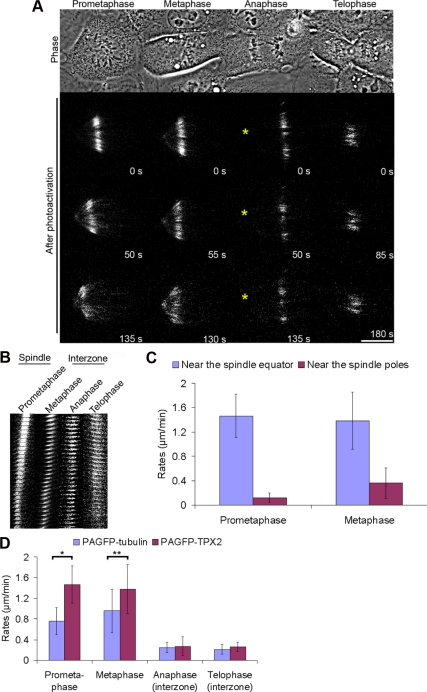
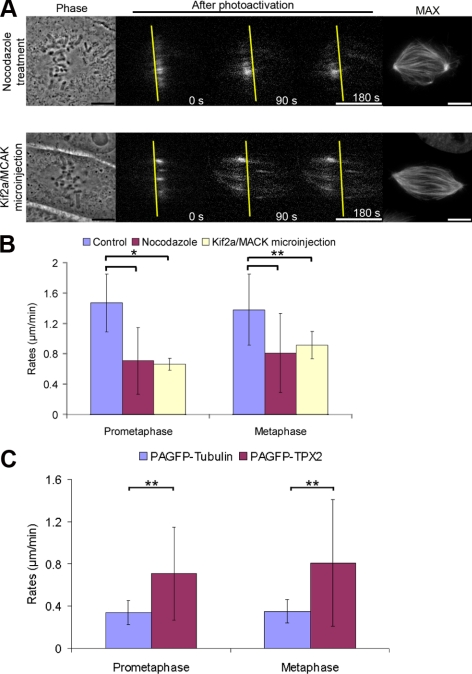
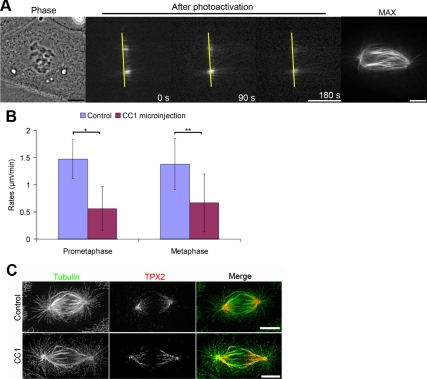
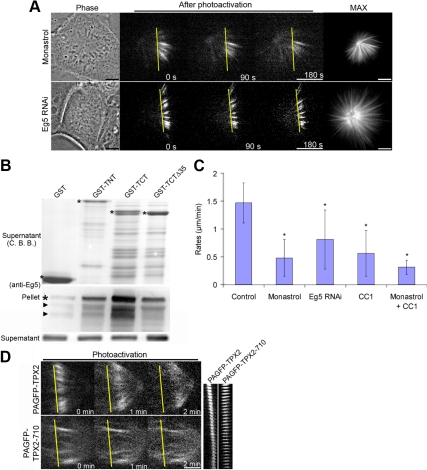
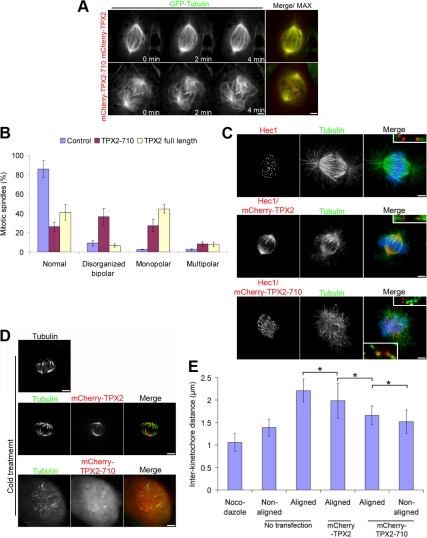
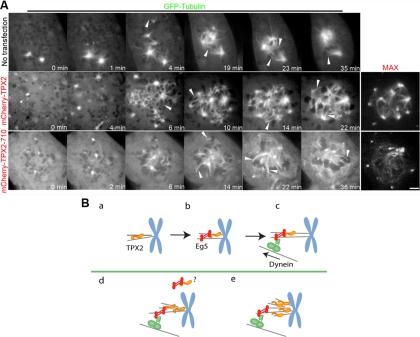
TPX2 is a Ran-regulated spindle assembly factor that is required for kinetochore fiber formation and activation of the mitotic kinase Aurora A. TPX2 is enriched near spindle poles and is required near kinetochores, suggesting that it undergoes dynamic relocalization throughout mitosis. Using photoactivation, we measured the movement of PA-GFP-TPX2 in the mitotic spindle. TPX2 moves poleward in the half-spindle and is static in the interzone and near spindle poles. Poleward transport of TPX2 is sensitive to inhibition of dynein or Eg5 and to suppression of microtubule flux with nocodazole or antibodies to Kif2a. Poleward transport requires the C terminus of TPX2, a domain that interacts with Eg5. Overexpression of TPX2 lacking this domain induced excessive microtubule formation near kinetochores, defects in spindle assembly and blocked mitotic progression. Our data support a model in which poleward transport of TPX2 down-regulates its microtubule nucleating activity near kinetochores and links microtubules generated at kinetochores to dynein for incorporation into the spindle.
Figures
Similar articles
-
Dynamic reorganization of Eg5 in the mammalian spindle throughout mitosis requires dynein and TPX2.Mol Biol Cell. 2012 Apr;23(7):1254-66. doi: 10.1091/mbc.E11-09-0820. Epub 2012 Feb 15. Mol Biol Cell. 2012. PMID: 22337772 Free PMC article.
-
TPX2 regulates the localization and activity of Eg5 in the mammalian mitotic spindle.J Cell Biol. 2011 Oct 3;195(1):87-98. doi: 10.1083/jcb.201106149. J Cell Biol. 2011. PMID: 21969468 Free PMC article.
-
Regulation of Kif15 localization and motility by the C-terminus of TPX2 and microtubule dynamics.Mol Biol Cell. 2017 Jan 1;28(1):65-75. doi: 10.1091/mbc.E16-06-0476. Epub 2016 Nov 16. Mol Biol Cell. 2017. PMID: 27852894 Free PMC article.
-
Chromosome movement: dynein-out at the kinetochore.Curr Biol. 2001 Feb 20;11(4):R128-31. doi: 10.1016/s0960-9822(01)00059-8. Curr Biol. 2001. PMID: 11250166 Review.
-
How the SAC gets the axe: Integrating kinetochore microtubule attachments with spindle assembly checkpoint signaling.Bioarchitecture. 2015;5(1-2):1-12. doi: 10.1080/19490992.2015.1090669. Epub 2015 Oct 2. Bioarchitecture. 2015. PMID: 26430805 Free PMC article. Review.
Cited by
-
Mechanisms by Which Kinesin-5 Motors Perform Their Multiple Intracellular Functions.Int J Mol Sci. 2021 Jun 15;22(12):6420. doi: 10.3390/ijms22126420. Int J Mol Sci. 2021. PMID: 34203964 Free PMC article. Review.
-
Central-spindle microtubules are strongly coupled to chromosomes during both anaphase A and anaphase B.Mol Biol Cell. 2019 Sep 1;30(19):2503-2514. doi: 10.1091/mbc.E19-01-0074. Epub 2019 Jul 24. Mol Biol Cell. 2019. PMID: 31339442 Free PMC article.
-
The multifaceted allosteric regulation of Aurora kinase A.Biochem J. 2018 Jun 26;475(12):2025-2042. doi: 10.1042/BCJ20170771. Biochem J. 2018. PMID: 29946042 Free PMC article. Review.
-
The molecular basis for kinesin functional specificity during mitosis.Cytoskeleton (Hoboken). 2013 Sep;70(9):476-93. doi: 10.1002/cm.21135. Epub 2013 Oct 8. Cytoskeleton (Hoboken). 2013. PMID: 24039047 Free PMC article. Review.
-
Distinct regions of the kinesin-5 C-terminal tail are essential for mitotic spindle midzone localization and sliding force.Proc Natl Acad Sci U S A. 2023 Sep 26;120(39):e2306480120. doi: 10.1073/pnas.2306480120. Epub 2023 Sep 19. Proc Natl Acad Sci U S A. 2023. PMID: 37725645 Free PMC article.
References
-
- Bayliss R., Sardon T., Vernos I., Conti E. Structural basis of Aurora A activation by TPX2 at the mitotic spindle. Mol. Cell. 2003;12:851–862. - PubMed
-
- Blangy A., Arnaud L., Nigg E. A. Phosphorylation by p34cdc2 protein kinase regulates binding of the kinesin related motor HsEg5 to the dynactin subunit p150glued. J. Biol. Chem. 1997;272:19418–19424. - PubMed
-
- Burbank K. S., Mitchison T. J., Fisher D. S. Slide-and-cluster models for spindle assembly. Curr. Biol. 2007;17:1373–1383. - PubMed
Publication types
MeSH terms
Substances
Grants and funding
LinkOut - more resources
Full Text Sources
Research Materials
Miscellaneous
