. 2010 Apr 2;285(14):10477-86.
doi: 10.1074/jbc.M109.064162. Epub 2010 Jan 28.

Estradiol induces export of sphingosine 1-phosphate from breast cancer cells via ABCC1 and ABCG2

Affiliations

Estradiol induces export of sphingosine 1-phosphate from breast cancer cells via ABCC1 and ABCG2

Kazuaki Takabe et al. J Biol Chem. .

Abstract

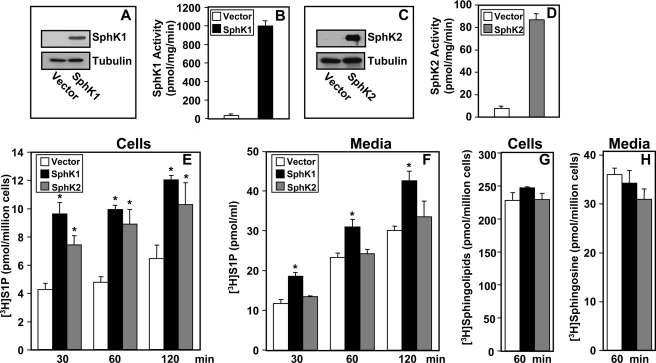
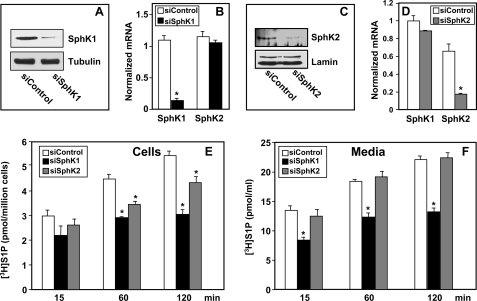
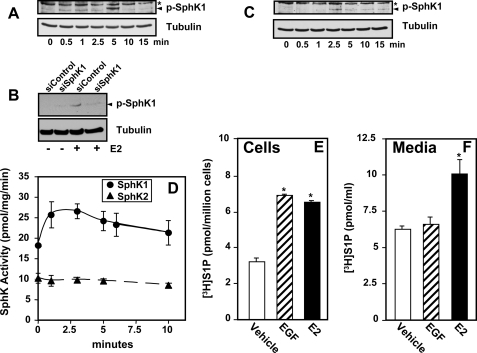
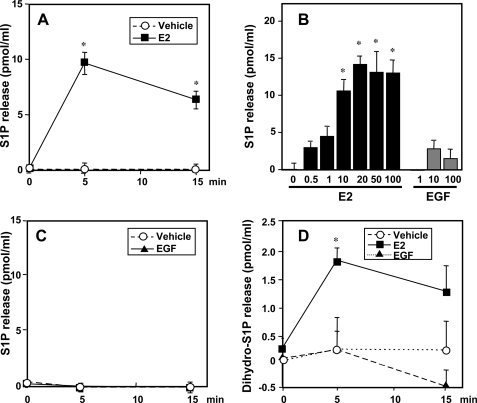
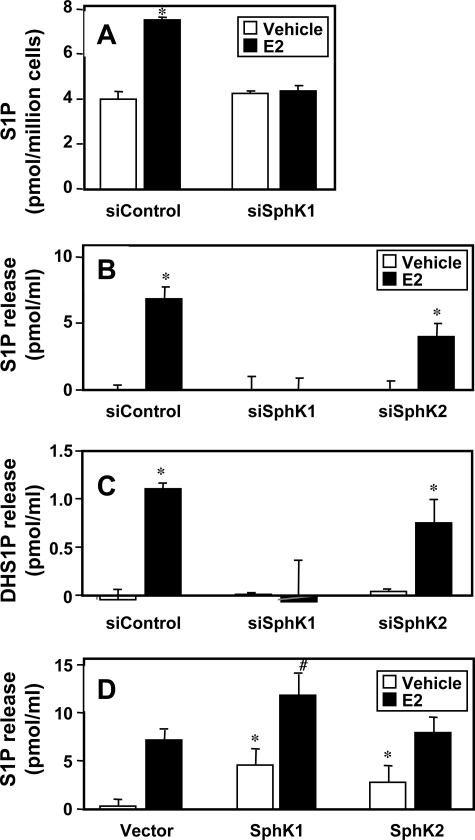
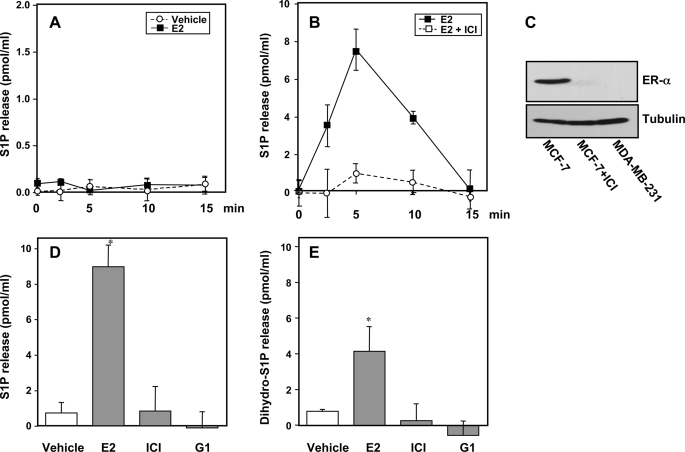
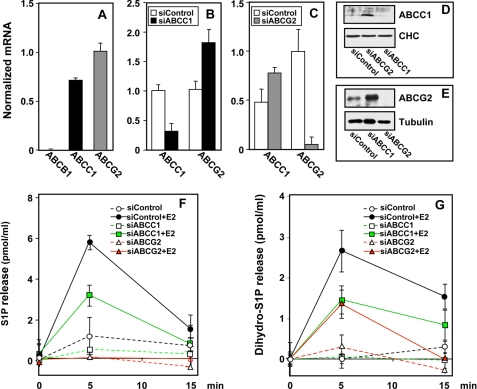
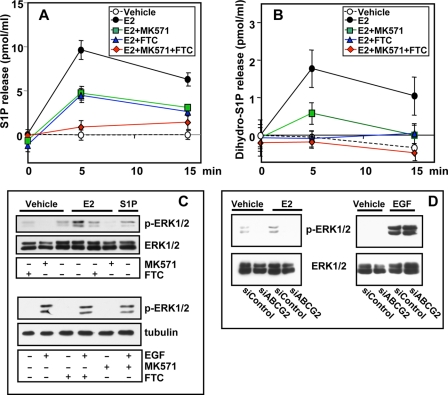
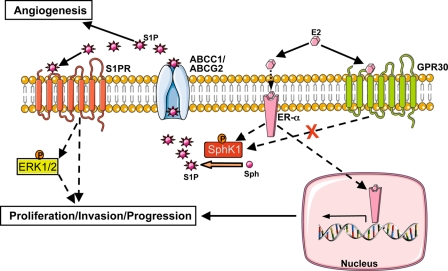
Sphingosine 1-phosphate (S1P), a potent sphingolipid mediator produced by sphingosine kinase isoenzymes (SphK1 and SphK2), regulates diverse cellular processes important for breast cancer progression acting in an autocrine and/or paracrine manner. Here we show that SphK1, but not SphK2, increased S1P export from MCF-7 cells. Whereas for both estradiol (E(2)) and epidermal growth factor-activated SphK1 and production of S1P, only E(2) stimulated rapid release of S1P and dihydro-S1P from MCF-7 cells. E(2)-induced S1P and dihydro-S1P export required estrogen receptor-alpha, not GPR30, and was suppressed either by pharmacological inhibitors or gene silencing of ABCC1 (multidrug resistant protein 1) or ABCG2 (breast cancer resistance protein). Inhibiting these transporters also blocked E(2)-induced activation of ERK1/2, indicating that E(2) activates ERK via downstream signaling of S1P. Taken together, our findings suggest that E(2)-induced export of S1P mediated by ABCC1 and ABCG2 transporters and consequent activation of S1P receptors may contribute to nongenomic signaling of E(2) important for breast cancer pathophysiology.


Figures

FIGURE 1.
FIGURE 1.
Expression of SphK1 but not SphK2 increases S1P secretion. MCF-7 cells were transfected with vector, V5-SphK1, or V5-SphK2. A and C, equal amounts of cell lysate proteins were separated by SDS-PAGE, transferred to nitrocellulose membranes, and immunoblotted with anti-V5 antibody. Blots were then stripped and re-probed with anti-tubulin antibody to demonstrate equal loading. B and D, SphK1 and SphK2 activities in lysates were determined with isoenzyme-specific assays. E and F, vector (open bars), V5-SphK1 (black bars), or V5-SphK2 (gray bars)-transfected MCF-7 cells were incubated for 10 min with [3H]sphingosine (1.5 μm, 0.45 μCi) in serum-free medium, washed extensively, fresh medium was added, and labeled lipids were extracted differentially at the indicated times from medium (F and H) and cells (E and G) into aqueous phases containing [3H]S1P (E and F) and organic phases (G and H) and quantified by scintillation counting as described under “Experimental Procedures.” Data are the mean ± S.D. of duplicate determinations. Cellular [3H]S1P is expressed as picomole/million cells and [3H]S1P in the medium is expressed as picomole/ml secreted by one million cells. *, p < 0.05 compared with vector. Similar results were obtained in two additional experiments.
FIGURE 2.
FIGURE 2.
Down-regulation of SphK1 but not SphK2 decreases S1P secretion. MCF-7 cells were transfected with control siRNA or siRNA targeted to SphK1 or SphK2, as indicated. Equal amounts of lysate or nuclear proteins were immunoblotted with anti-SphK1 (A) or anti-SphK2 (C). Blots were stripped and reprobed with anti-tubulin (A) or lamin (C) to confirm equal loading. B and D, RNA was isolated from duplicate cultures and SphK1 and SphK2 mRNA determined by quantitative real time PCR and normalized to levels of glyceraldehyde-3-phosphate dehydrogenase mRNA. E and F, siControl (open bars), siSphK1 (black bars), or siSphK2 (gray bars) transfected MCF-7 cells were incubated for 10 min with [3H]sphingosine (1.5 μm, 0.45 μCi) in serum-free medium, washed extensively, fresh medium was added, and [3H]S1P in cells (E) or secreted into the medium (F) was measured at the indicated times. Data are the mean ± S.D. of duplicate determinations. Similar results were obtained in two additional experiments. *, p < 0.05 compared with siControl.
FIGURE 3.
FIGURE 3.
Effect of E2 and EGF on SphK1 and S1P formation and secretion. A, MCF-7 cells were stimulated with E2 for the indicated times. B, MCF-7 cells were transfected with control siRNA or siRNA targeted to SphK1 and stimulated without or with E2. C, MCF-7 cells were stimulated with EGF for the indicated times. A–C, cell lysates were prepared, and equal amounts of protein were separated by SDS-PAGE and analyzed by immunoblotting with anti-phospho-SphK1 antibody. Blots were stripped and re-probed with anti-tubulin to ensure equal loading and transfer. The asterisks indicate nonspecific immunostained bands and the arrowheads indicate SphK1. D, MCF-7 cells were stimulated without or with E2 for the indicated times. Cells were lysed and SphK1 activity (circles) was measured with sphingosine added as Triton X-100 mixed micelles and SphK2 activity (triangles) with sphingosine added as a bovine serum albumin complex in the presence of 1 m KCl. *, p < 0.05 for SphK1 activity at all time points compared with unstimulated (t = 0). E and F, MCF-7 cells were serum starved overnight, prelabled with [3H]sphingosine (1.5 μm, 0.45 μCi), and washed extensively, fresh medium was added and then stimulated without (vehicle) or with EGF (50 ng/ml) or E2 (10 nm) for 5 min, and the [3H]S1P in cells (E) or secreted into the medium (F) determined. Data are expressed as mean ± S.D. Similar results were obtained in two independent experiments. *, p < 0.05.
FIGURE 4.
FIGURE 4.
E2 but not EGF stimulates release of S1P and dihydro-S1P from MCF-7 cells. MCF-7 cells were stimulated with vehicle (open circles) or 20 nm E2 (filled squares) for the indicated times (A and C), for 5 min with the indicated concentrations of E2 or EGF (B), or with 10 ng/ml of EGF (filled triangles) for the indicated times (C and D). S1P (A–C) and dihydro-S1P (D) released into the medium were measured by LC-ESI-MS/MS. Data are expressed as picomole of phosphorylated sphingoid base/ml and are mean ± S.D. Levels of S1P and dihydro-S1P in the cells at zero time (7.4 ± 1 and 2.8 ± 0.2 pmol/ml, respectively) were subtracted from all values. *, p < 0.01 compared with vehicle. Similar results were obtained in three independent experiments.
FIGURE 5.
FIGURE 5.
SphK1 is important for E2-mediated release of S1P and dihydro-S1P from MCF-7 cells. A, MCF-7 cells were transfected with siControl or siSphK1 and treated with vehicle (open bars) or 10 nm E2 (black bars) for 5 min. Lipids were extracted from 106 cells and S1P was determined by LC-ESI-MS/MS. *, p < 0.01 compared with vehicle. B, MCF-7 cells were transfected with siControl, siSphK1, or siSphK2 and treated with vehicle (open bars) or 10 nm E2 (black bars) for 5 min. S1P (B) and dihydro-S1P (DHS1P) (C) released into the medium was determined by LC-ESI-MS/MS. Levels at zero time were subtracted and data expressed as mean ± S.D. *, p < 0.01 compared with vehicle. Similar results were obtained in two additional experiments. D, MCF-7 cells were transfected with vector, SphK1, or SphK2 and treated with vehicle (open bars) or with 10 nm E2 (black bars) for 5 min. S1P released into the medium was determined by LC-ESI-MS/MS. Levels at zero time were subtracted and data expressed as mean ± S.D. *, p < 0.05 compared with unstimulated vector; #, p < 0.05 compared with E2-stimulated vector. Similar results were obtained in two additional experiments.
FIGURE 6.
FIGURE 6.
ER-α is necessary for E2-mediated release of S1P and dihydro-S1P. A, MDA-MB-231 cells were stimulated with vehicle (open circles) or 10 nm E2 (filled squares) for the indicated times and S1P released into the medium was measured by LC-ESI-MS/MS. Levels of S1P in the medium of MDA-MB-231 cells at zero time (0.6 ± 0.1 pmol/ml) were subtracted from all values. B, MCF-7 cells were pretreated for 18 h without or with 10 μm ICI 182,780 and then stimulated with 10 nm E2 and S1P release was determined at the indicated times by mass spectrometry. Levels of S1P in the medium of MCF-7 cells at zero time (8.8 ± 0.7 pmol/ml) was subtracted and data expressed as mean ± S.D. C, equal amounts of proteins from lysates of duplicate cultures of MDA-MB-231 and MCF-7 cells treated as in A and B, respectively, were separated by SDS-PAGE and analyzed by immunoblotting with anti-ER-α antibody. Blots were stripped and reprobed with anti-tubulin to confirm equal loading. D and E, MCF-7 cells were treated with vehicle, 10 nm E2, 10 μm ICI 182,780, or 10 nm G1 for 5 min. S1P (D) and dihydro-S1P (E) released into the medium were determined by LC-ESI-MS/MS. Levels at zero time were subtracted and data are expressed as mean ± S.D. *, p < 0.01 compared with vehicle. Similar results were obtained in two additional experiments.
FIGURE 7.
FIGURE 7.
Down-regulation of ABCC1 or ABCG2 decreases E2-mediated release of S1P or dihydro-S1P. A, RNA was isolated from MCF-7 cells and mRNA of ABCB1, ABCC1, and ABCG2 determined by quantitative real time reverse transcription-PCR and normalized to cyclophilin mRNA. B–E, MCF-7 cells were transfected with control siRNA (open bars) or siRNA targeted to ABCC1 (black bars) or ABCG2 (gray bars), as indicated. Expression of ABCC1 and ABCG2 was determined by quantitative real-time reverse transcription-PCR and normalized to glyceraldehyde-3-phosphate dehydrogenase mRNA. D and E, equal amounts of cell lysate proteins from duplicate cultures were immunoblotted with anti-ABCC1 (D) or anti-ABCG2 (E). Blots were stripped and reprobed with anti-clathrin heavy chain (CHC) or anti-tubulin, as indicated, to confirm equal loading. F and G, MCF-7 cells were transfected with siControl, siABCC1, or siABCG2 and stimulated with vehicle or E2 (10 nm) for the indicated times. S1P (F) and dihydro-S1P (G) released into the medium was determined by LC-ESI-MS/MS. Levels of S1P and dihydro-S1P at zero time (7 ± 0.7 and 1.5 ± 0.3 pmol/ml, respectively) were subtracted and data expressed as mean ± S.D. All values at 5 min were statistically significant (p < 0.01) compared with siControl treated with E2 at 5 min. Similar results were obtained in two additional experiments.
FIGURE 8.
FIGURE 8.
Pharmacological inhibitors of ABCC1 or ABCG2 decrease E2-mediated release of S1P and dihydro-S1P and ERK1/2 activation. MCF-7 cells were preincubated for 2 h without or with 20 μm MK571 or 20 μm FTC, or both, followed by stimulation with vehicle or E2 (10 nm) for the indicated times (A and B), for 10 min with 10 nm E2, or with 10 ng/ml EGF (C). S1P (A) and dihydro-S1P (B) released was determined by LC-ESI-MS/MS. Levels of S1P and dihydro-S1P in the cells at zero time (7 ± 0.6 and 2.9 ± 0.2 pmol/ml, respectively) were subtracted and data expressed as mean ± S.D. All values at 5 and 15 min were statistically significant (p < 0.05) compared with control cells treated with E2. Similar results were obtained in two additional experiments. C, equal amounts of proteins were separated by SDS-PAGE and analyzed by immunoblotting with anti-phospho-ERK1/2 antibody. D, MCF-7 cells were transfected with siControl or siABCG2 and stimulated with vehicle, E2 (20 nm), or EGF (10 ng/ml) for 10 min, and ERK1/2 activation was determined by immunoblotting with anti-phospho-ERK1/2 antibody. Blots were stripped and reprobed with anti-total ERK antibodies to confirm equal loading and transfer.
FIGURE 9.
FIGURE 9.
Scheme highlighting the importance of ABC transporters and S1P/dihydro-S1P export from the cell in nongenomic effects of E2. See text for more details. For simplicity, many other known signaling pathways downstream of ER are not shown. Binding of E2 to ER-α and not GPR30 stimulates release of S1P (and dihydro-S1P, not shown here) via ABC transporters, ABCC1 and ABCG2. This S1P in turn binds to and activates S1P receptors to stimulate ERK1/2 leading to downstream signaling events important for breast cancer proliferation, progression, and invasion.

Similar articles

Cited by

References

    1. Takabe K., Paugh S. W., Milstien S., Spiegel S. (2008) Pharmacol. Rev. 60, 181–195 - PMC - PubMed
    1. Spiegel S., Milstien S. (2003) Nat. Rev. Mol. Cell Biol. 4, 397–407 - PubMed
    1. Hannun Y. A., Obeid L. M. (2008) Nat. Rev. Mol. Cell Biol. 9, 139–150 - PubMed
    1. Saba J. D., Hla T. (2004) Circ. Res. 94, 724–734 - PubMed
    1. Okada T., Ding G., Sonoda H., Kajimoto T., Haga Y., Khosrowbeygi A., Gao S., Miwa N., Jahangeer S., Nakamura S. (2005) J. Biol. Chem. 280, 36318–36325 - PubMed

Publication types

MeSH terms