

Immune phenotype predicts risk for posttransplantation squamous cell carcinoma
- PMID: 20110382
- PMCID: PMC2844307
- DOI: 10.1681/ASN.2009060669
Immune phenotype predicts risk for posttransplantation squamous cell carcinoma
Abstract
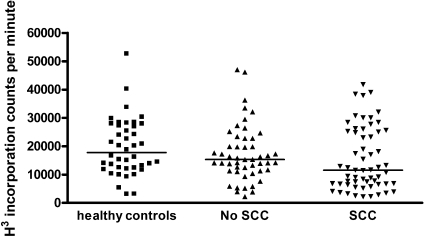
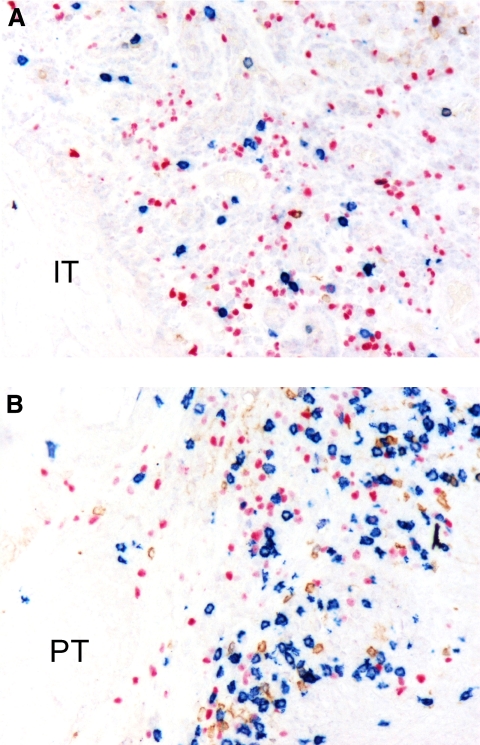
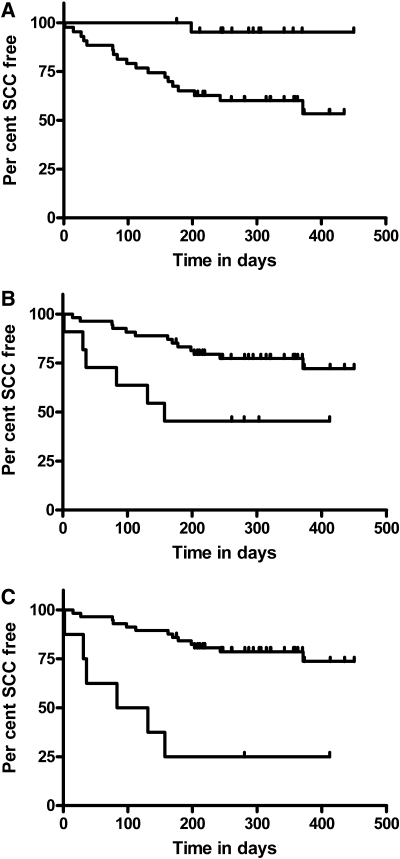
Cutaneous squamous cell cancer (SCC) affects up to 30% of kidney transplant recipients (KTRs) within 10 years of transplantation. There are no reliable clinical tests that predict those who will develop multiple skin cancers. High numbers of regulatory T cells associate with poor prognosis for patients with cancer in the general population, suggesting their potential as a predictive marker of cutaneous SCC in KTRs. We matched KTRs with (n = 65) and without (n = 51) cutaneous SCC for gender, age, and duration of immunosuppression and assessed several risk factors for incident SCC during a median follow-up of 340 days. Greater than 35 peripheral FOXP3(+)CD4(+)CD127(low) regulatory T cells/microl, <100 natural killer cells/microl, and previous SCC each significantly associated with increased risk for new cutaneous SCC development (hazard ratio [HR] 2.48 [95% confidence interval (CI) 1.04 to 5.98], HR 5.6 [95% CI 1.31 to 24], and HR 1.33 [95% CI 1.15 to 1.53], respectively). In addition, the ratio of CD8/FOXP3 expression was significantly lower in cutaneous SCC excised from KTRs (n = 25) compared with matched SCC from non-KTRs (n = 25) and associated with development of new cutaneous SCCs. In summary, monitoring components of the immune system can predict development of cutaneous SCC among KTRs.
Figures
Comment in
-
Transplantation: T(REG) cells predict risk of cutaneous squamous cell cancer after transplantation.Nat Rev Nephrol. 2010 May;6(5):249. doi: 10.1038/nrneph.2010.51. Nat Rev Nephrol. 2010. PMID: 20440866 No abstract available.
Similar articles
-
Immune phenotype of peripheral blood cells and skin squamous cell carcinoma in organ transplant recipients.Expert Rev Clin Immunol. 2010 May;6(3):359-62. doi: 10.1586/eci.10.21. Expert Rev Clin Immunol. 2010. PMID: 20441422
-
Conversion to sirolimus in kidney transplant recipients with squamous cell cancer and changes in immune phenotype.Nephrol Dial Transplant. 2013 Feb;28(2):462-5. doi: 10.1093/ndt/gfs474. Epub 2012 Dec 7. Nephrol Dial Transplant. 2013. PMID: 23223314 Free PMC article. Clinical Trial.
-
CD8+ Immunosenescence Predicts Post-Transplant Cutaneous Squamous Cell Carcinoma in High-Risk Patients.J Am Soc Nephrol. 2016 May;27(5):1505-15. doi: 10.1681/ASN.2015030250. Epub 2015 Nov 12. J Am Soc Nephrol. 2016. PMID: 26563386 Free PMC article.
-
Comparative immune phenotypic analysis of cutaneous Squamous Cell Carcinoma and Intraepidermal Carcinoma in immune-competent individuals: proportional representation of CD8+ T-cells but not FoxP3+ Regulatory T-cells is associated with disease stage.PLoS One. 2014 Oct 23;9(10):e110928. doi: 10.1371/journal.pone.0110928. eCollection 2014. PLoS One. 2014. PMID: 25340823 Free PMC article.
-
Interleukin-22 and Cyclosporine in Aggressive Cutaneous Squamous Cell Carcinoma.Dermatol Clin. 2017 Jan;35(1):73-84. doi: 10.1016/j.det.2016.07.003. Dermatol Clin. 2017. PMID: 27890239 Free PMC article. Review.
Cited by
-
Cohort profile: the skin cancer after organ transplant study.Int J Epidemiol. 2013 Dec;42(6):1669-77. doi: 10.1093/ije/dys179. Epub 2012 Nov 21. Int J Epidemiol. 2013. PMID: 23171871 Free PMC article.
-
What Are the Roles of Proprotein Convertases in the Immune Escape of Tumors?Biomedicines. 2022 Dec 19;10(12):3292. doi: 10.3390/biomedicines10123292. Biomedicines. 2022. PMID: 36552048 Free PMC article. Review.
-
Immunosenescence and Skin: A State of Art of Its Etiopathogenetic Role and Crucial Watershed for Systemic Implications.Int J Mol Sci. 2023 Apr 27;24(9):7956. doi: 10.3390/ijms24097956. Int J Mol Sci. 2023. PMID: 37175661 Free PMC article. Review.
-
Differentially methylated regions in T cells identify kidney transplant patients at risk for de novo skin cancer.Clin Epigenetics. 2018 Jun 18;10:81. doi: 10.1186/s13148-018-0519-7. eCollection 2018. Clin Epigenetics. 2018. PMID: 29946375 Free PMC article.
-
Sirolimus Increases T-Cell Abundance in the Sun Exposed Skin of Kidney Transplant Recipients.Transplant Direct. 2017 Jun 6;3(7):e171. doi: 10.1097/TXD.0000000000000694. eCollection 2017 Jul. Transplant Direct. 2017. PMID: 28706974 Free PMC article.
References
-
- Zand MS: Immunosuppression and immune monitoring after renal transplantation. Semin Dial 18: 511– 519, 2005 - PubMed
-
- Kauffman HM, Cherikh WS, McBride MA, Cheng Y, Hanto DW: Post-transplant de novo malignancies in renal transplant recipients: The past and present. Transpl Int 19: 607– 620, 2006 - PubMed
-
- Faull RJ, Hollett P, McDonald SP: Lymphoproliferative disease after renal transplantation in Australia and New Zealand. Transplantation 80: 193– 197, 2005 - PubMed
-
- Webster AC, Wong G, Craig JC, Chapman JR: Managing cancer risk and decision making after kidney transplantation. Am J Transplant 8: 2185– 2191, 2008 - PubMed
-
- Kasiske BL, Snyder JJ, Gilbertson DT, Wang C: Cancer after kidney transplantation in the United States. Am J Transplant 4: 905– 913, 2004 - PubMed
Publication types
MeSH terms
LinkOut - more resources
Full Text Sources
Other Literature Sources
Medical
Research Materials
