. 2010 Mar;176(3):1517-24.
doi: 10.2353/ajpath.2010.090398. Epub 2010 Jan 28.

Inhibition of protein kinase C delta attenuates blood-retinal barrier breakdown in diabetic retinopathy

Affiliations

Inhibition of protein kinase C delta attenuates blood-retinal barrier breakdown in diabetic retinopathy

Jeong-Hun Kim et al. Am J Pathol. 2010 Mar.

Abstract

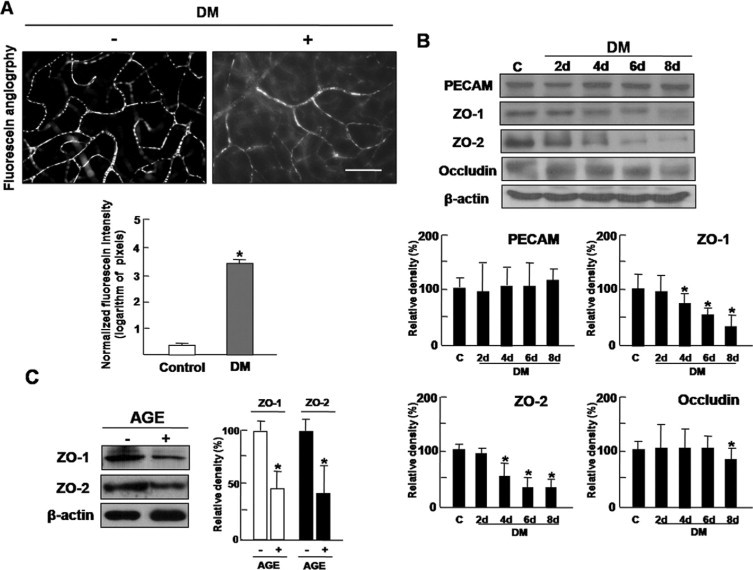
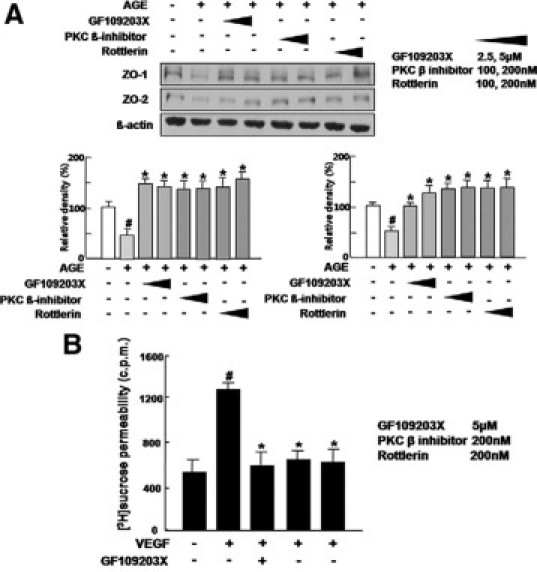
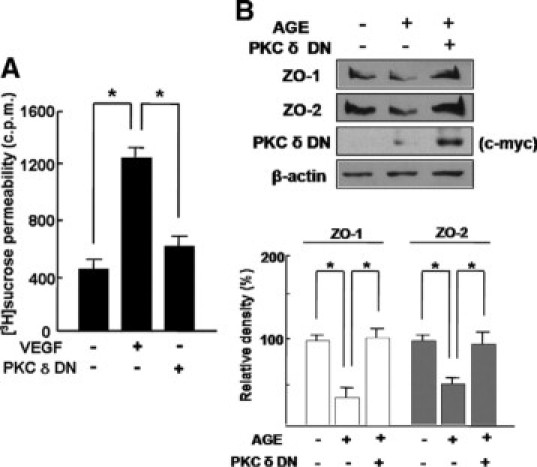
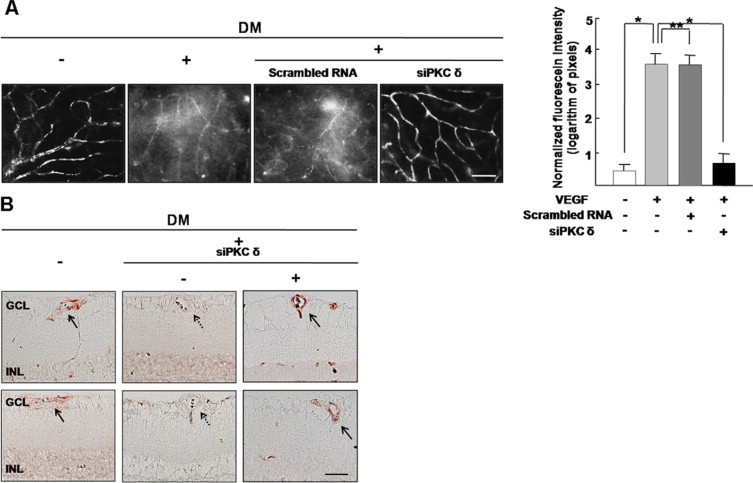
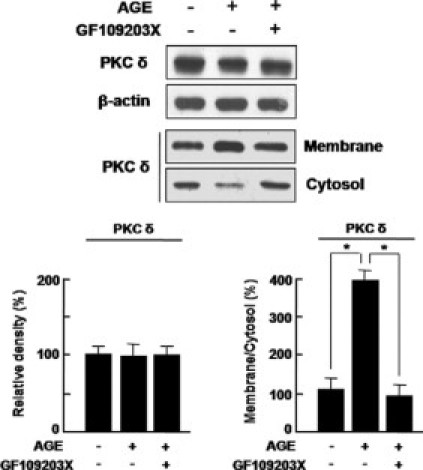
Vision loss in diabetic retinopathy is due to macular edema characterized by increased vascular permeability, which involves phosphorylation associated with activation of protein kinase C (PKC) isoforms. Herein, we demonstrated PKC delta inhibition could prevent blood-retinal barrier breakdown in diabetic retinopathy. Increased vascular permeability of diabetic retina was accompanied by a decrease of zonula occludens (ZO)-1 and ZO-2 expression. In diabetic retina and advanced glycation end product-treated human retinal microvascular endothelial cells, vascular leakage and loss of ZO-1 and ZO-2 on retinal vessels were effectively restored or prevented with treatment of rottlerin, transfection of PKC-delta-DN, or siRNA for PKC delta. Interestingly, PKC delta translocated from cytosol to membrane in advanced glycation end product-treated human retinal microvascular endothelial cells, which was blocked by PKC delta inhibition. Taken together, PKC delta activation, related to its subcellular translocation, is involved in vascular permeability in response to diabetes, and inhibition of PKC delta effectively restores loss of tight junction proteins in retinal vessels. Therefore, we suggest that inhibition of PKC delta could be an alternative treatment to blood-retinal barrier breakdown in diabetic retinopathy.


Figures

Figure 1
Figure 1
Increased vascular permeability of diabetic retina is accompanied by decrease of tight junction proteins. A: Increased vascular permeability was evaluated by fluorescein angiography using FITC-BSA. Whole-mount retinal preparation from 8 days after streptozotocin injection was performed after 1 hour perfusion of FITC-BSA. These experiments were repeated over three times with similar results. FITC-BSA fluorescence intensity was measured by image analysis in serial retinal sections. The average retinal FITC-BSA fluorescence intensity was calculated and normalized to plasma fluorescence intensity. Figures were selected as representative data from three independent experiments. Scale bars = 100 μm. *P < 0.005. DM, diabetes mellitus. B: At 2, 4, 6, and 8 days after streptozotocin injection, retinal proteins of diabetic mice were analyzed by Western blot analysis using PECAM, ZO-1, ZO-2, and occludin antibodies. β-Actin served as the loading control. DM, diabetes mellitus. C: HRMEC proteins from cells incubated with AGE treatment (10 μg/ml) for 12 hours were analyzed by Western blot analysis using ZO-1 and ZO-2 antibodies. β-Actin was served as the loading control. B and C: Quantitative analysis was performed by measuring protein expression relative to the control. Each point represents the mean (±SD) of three independent experiments, each performed in triplicate. *P < 0.005. Figures were selected as representative data from three independent experiments. DM, diabetes mellitus.
Figure 2
Figure 2
Inhibitors of PKC isoforms attenuate loss of tight junction proteins under diabetic condition and VEGF-induced hyperpermeability in HRMECs. A: HRMECs were incubated for 12 hours with or without the inhibitors of PKC isoforms including 5 μmol/L GF109203X), 200 nmol/L a PKC β inhibitor and 200 nmol/L rottlerin in AGE treatment and assayed for the expression of ZO-1 and ZO-2. ß-actin was served as the loading control. Figures were selected as representative data from three independent experiments. Quantitative analysis was performed by measuring protein expression relative to the control. Each point represents the mean (±SD) of three independent experiments, each performed in triplicate. *P < 0.05. #Comparison between control and AGE only treatment. *Comparison between AGE only treatment and AGE with PKC inhibitor treatment. #P, *P < 0.05. B: VEGF, 20 ng/ml, or the inhibitors of PKC isoforms including 5 μmol/L GF109203X), 200 nmol/L PKC β inhibitor, and 200 nmol/L rottlerin were treated for 6 hours in HRMECs. [3H]sucrose permeability assay in HRMECs treated with VEGF or the inhibitors was measured as counts per minute (c.p.m.). Each point represents the mean (±SD) of three independent experiments, each performed in triplicate. #Comparison between control and VEGF only treatment. *Comparison between VEGF only treatment and VEGF with PKC inhibitor treatment. #P, *P < 0.05.
Figure 3
Figure 3
Inhibition of PKC δ by PKC-δ-DN attenuates VEGF-induced hyperpermeability and loss of tight junction proteins under diabetic condition in HRMECs. A: VEGF, 20 ng/ml, was treated for 6 hours in HRMECs with or without transfection of PKC-δ-DN plasmid. [3H]sucrose permeability assay in HRMECs was measured as counts per minute (c.p.m.). Each point represents the mean (±SD) of three independent experiments, each performed in triplicate. *P < 0.05. B: HRMECs were transfected by PKC-δ-DN plasmid. Cells were subsequently cultured for 48 hours to allow for detectable protein expression and were additionally incubated for 12 hours in AGE treatment. The expression of ZO-1 and ZO-2 was assessed, and transfection of PKC-δ-DN was confirmed by expression of c-myc. β-Actin was served as the loading control. Figures were selected as representative data from three independent experiments. Quantitative analysis was performed by measuring protein expression relative to the control. Each point represents the mean (±SD) of three independent experiments, each performed in triplicate. *P < 0.05.
Figure 4
Figure 4
Inhibition of PKC δ by siPKC δ attenuates VEGF-induced hyperpermeability and loss of tight junction proteins under diabetic condition in HRMECs. A: VEGF, 20 ng/ml, was treated for 6 hours in HRMECs with or without transfection of scrambled RNA or siPKC δ. [3H]sucrose permeability assay in HRMECs was measured as counts per minute (c.p.m.). Each point represents the mean (±SD) of three independent experiments, each performed in triplicate. *P < 0.05; **P > 0.05. B: HRMECs were transfected with siPKC δ and assayed for the expression of ZO-1 and ZO-2 in AGE treatment. The efficacy of knockdown was assessed using western blotting with anti-PKC δ antibody. β-Actin served as the loading control. Figures were selected as representative data from three independent experiments. Quantitative analysis was performed by measuring protein expression relative to the control. Each point represents the mean (±SD) of three independent experiments, each performed in triplicate. *P < 0.05; **P > 0.05.
Figure 5
Figure 5
Inhibition of PKC δ by siPKC δ attenuates vascular leakage in diabetic retina, accompanied by restoration of tight junction proteins on retinal vessels. A: Vascular leakage in the retina was evaluated by fluorescein angiography using FITC-BSA. Whole-mount retinal preparation from 8 days after streptozotocin injection with or without intravitreal injection of siPKC δ was performed after 1 hour of perfusion of FITC-BSA. These experiments were repeated over three times with similar results. Figures were selected as representative data from three independent experiments. FITC-BSA fluorescence intensity was measured by image analysis in serial retinal sections. The average retinal FITC-BSA fluorescence intensity was calculated and normalized to plasma fluorescence intensity. Scale bars = 100 μm. *P < 0.05; **P > 0.05. DM, diabetes mellitus. B: Immunohistochemistry for ZO-1 and ZO-2 was performed in diabetic retina with or without intravitreal injection of siPKC δ. Arrows indicate ZO-1 (upper panel) or ZO-2 (lower panel) expression on retinal vessels, whereas arrow with dotted line indicates loss of ZO-1 (upper panel) or ZO-2 (lower panel). Figures were selected as representative data from three independent experiments. Scale bars = 50 μm. DM, diabetes mellitus; GCL, ganglion cell layer; INL, inner nuclear layer; ONL, outer nuclear layer.
Figure 6
Figure 6
Translocation of PKC δ from cytosol to membrane in HRMECs was significantly increased under diabetic condition, but not PKC δ expression. HRMECs were incubated for 12 hours with or without a pan-PKC inhibitor, GF109203X (5 μmol/L) in AGE treatment. Cell extracts were fractionated as a membrane and a cytosol fraction. In each fraction, PKC δ expression was assessed by Western blotting. β-Actin served as the loading control. Figures were selected as representative data from three independent experiments. Quantitative analysis was performed by measuring protein expression relative to the control. Each point represents the mean (±SD) of three independent experiments, each performed in triplicate. *P < 0.05.

Similar articles

Cited by

References

    1. Porta M, Bandello F. Diabetic retinopathy: an update. Diabetologia. 2002;45:1617–1634. - PubMed
    1. Frank RN. Diabetic retinopathy. N Engl J Med. 2004;350:48–58. - PubMed
    1. Davidson JA, Ciulla TA, McGill JB, Kles KA, Anderson PW. How the diabetic eye loses vision. Endocrine. 2007;32:107–116. - PubMed
    1. Mizutani M, Gerhardinger C, Lorenzi M. Muller cell changes in human diabetic retinopathy. Diabetes. 1998;47:445–449. - PubMed
    1. Lorenzi M, Gerhardinger C. Early cellular and molecular changes induced by diabetes in the retina. Diabetologia. 2001;44:791–804. - PubMed

Publication types

MeSH terms