

The asynchronous state in cortical circuits
- PMID: 20110507
- PMCID: PMC2861483
- DOI: 10.1126/science.1179850
The asynchronous state in cortical circuits
Abstract
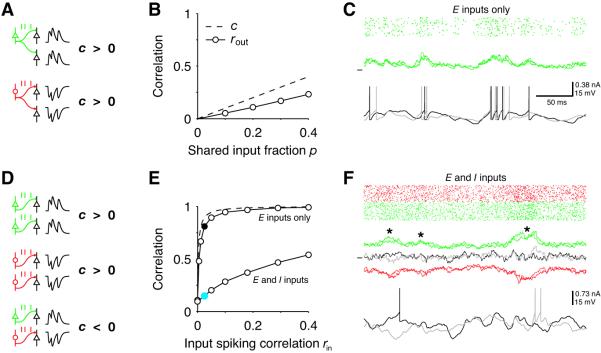
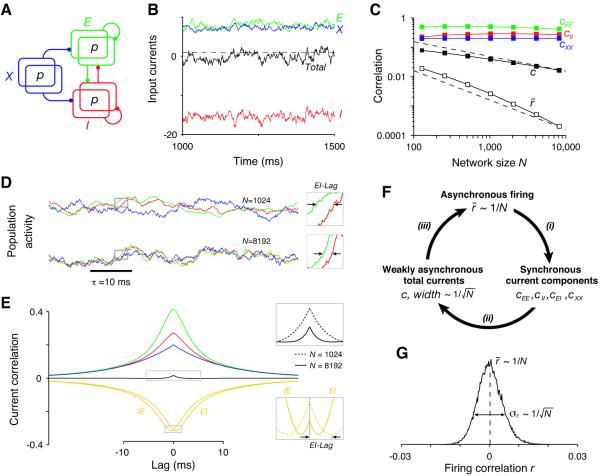
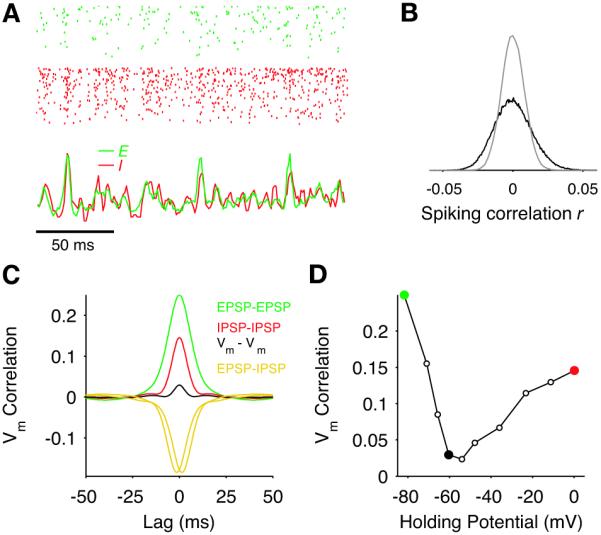
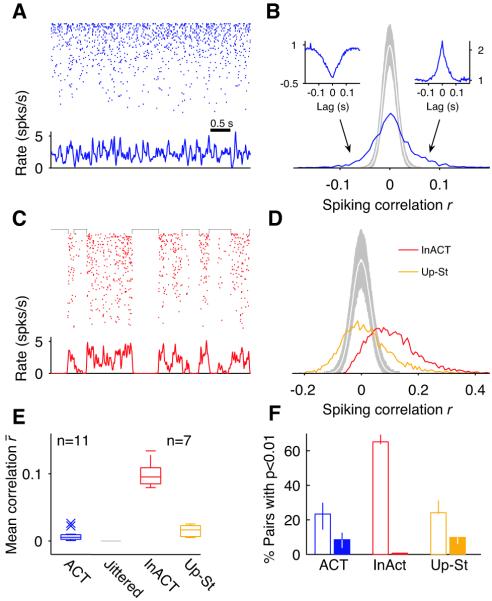
Correlated spiking is often observed in cortical circuits, but its functional role is controversial. It is believed that correlations are a consequence of shared inputs between nearby neurons and could severely constrain information decoding. Here we show theoretically that recurrent neural networks can generate an asynchronous state characterized by arbitrarily low mean spiking correlations despite substantial amounts of shared input. In this state, spontaneous fluctuations in the activity of excitatory and inhibitory populations accurately track each other, generating negative correlations in synaptic currents which cancel the effect of shared input. Near-zero mean correlations were seen experimentally in recordings from rodent neocortex in vivo. Our results suggest a reexamination of the sources underlying observed correlations and their functional consequences for information processing.
Figures
Similar articles
-
Synaptic input correlations leading to membrane potential decorrelation of spontaneous activity in cortex.J Neurosci. 2013 Sep 18;33(38):15075-85. doi: 10.1523/JNEUROSCI.0347-13.2013. J Neurosci. 2013. PMID: 24048838 Free PMC article.
-
Functional consequences of correlated excitatory and inhibitory conductances in cortical networks.J Comput Neurosci. 2010 Jun;28(3):579-94. doi: 10.1007/s10827-010-0240-9. Epub 2010 May 19. J Comput Neurosci. 2010. PMID: 20490645
-
The high-conductance state of cortical networks.Neural Comput. 2008 Jan;20(1):1-43. doi: 10.1162/neco.2008.20.1.1. Neural Comput. 2008. PMID: 18044999
-
Modelling and analysis of local field potentials for studying the function of cortical circuits.Nat Rev Neurosci. 2013 Nov;14(11):770-85. doi: 10.1038/nrn3599. Nat Rev Neurosci. 2013. PMID: 24135696 Review.
-
Neuronal circuits of the neocortex.Annu Rev Neurosci. 2004;27:419-51. doi: 10.1146/annurev.neuro.27.070203.144152. Annu Rev Neurosci. 2004. PMID: 15217339 Review.
Cited by
-
Neural synchrony in cortical networks: mechanisms and implications for neural information processing and coding.Front Integr Neurosci. 2022 Oct 3;16:900715. doi: 10.3389/fnint.2022.900715. eCollection 2022. Front Integr Neurosci. 2022. PMID: 36262373 Free PMC article.
-
A prefrontal network model operating near steady and oscillatory states links spike desynchronization and synaptic deficits in schizophrenia.Elife. 2024 Feb 6;13:e79352. doi: 10.7554/eLife.79352. Elife. 2024. PMID: 38319151 Free PMC article.
-
Horizontal cortical connections shape intrinsic traveling waves into feature-selective motifs that regulate perceptual sensitivity.Res Sq [Preprint]. 2024 Jan 9:rs.3.rs-3830199. doi: 10.21203/rs.3.rs-3830199/v1. Res Sq. 2024. Update in: Cell Rep. 2024 Sep 24;43(9):114707. doi: 10.1016/j.celrep.2024.114707. PMID: 38260448 Free PMC article. Updated. Preprint.
-
Excitation-Inhibition Balanced Neural Networks for Fast Signal Detection.Front Comput Neurosci. 2020 Sep 3;14:79. doi: 10.3389/fncom.2020.00079. eCollection 2020. Front Comput Neurosci. 2020. PMID: 33013343 Free PMC article.
-
Circuit mechanisms revealed by spike-timing correlations in macaque area MT.J Neurophysiol. 2013 Feb;109(3):851-66. doi: 10.1152/jn.00775.2012. Epub 2012 Nov 14. J Neurophysiol. 2013. PMID: 23155171 Free PMC article.
References
Publication types
MeSH terms
Grants and funding
LinkOut - more resources
Full Text Sources
Other Literature Sources
