

Contactin-2 expression in the cardiac Purkinje fiber network
- PMID: 20110552
- PMCID: PMC3068837
- DOI: 10.1161/CIRCEP.109.928820
Contactin-2 expression in the cardiac Purkinje fiber network
Abstract
Background: Purkinje cells (PCs) comprise the most distal component of the cardiac conduction system, and their unique electrophysiological properties and the anatomic complexity of the Purkinje fiber network may account for the prominent role these cells play in the genesis of various arrhythmic syndromes.
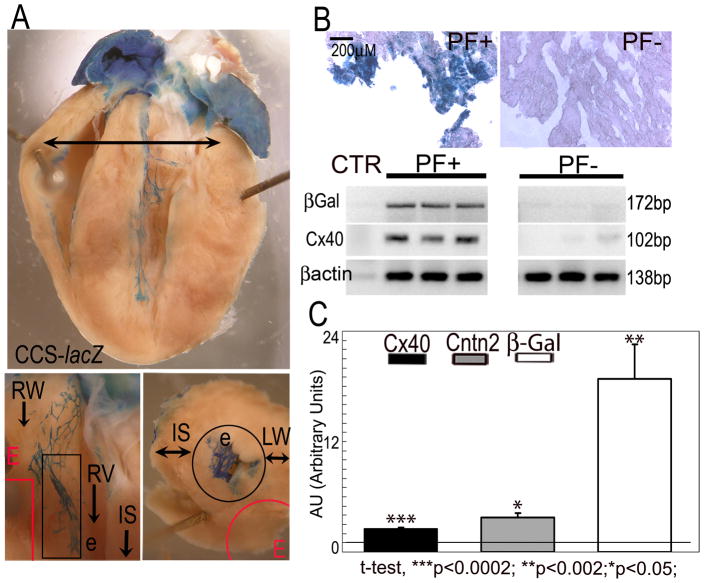
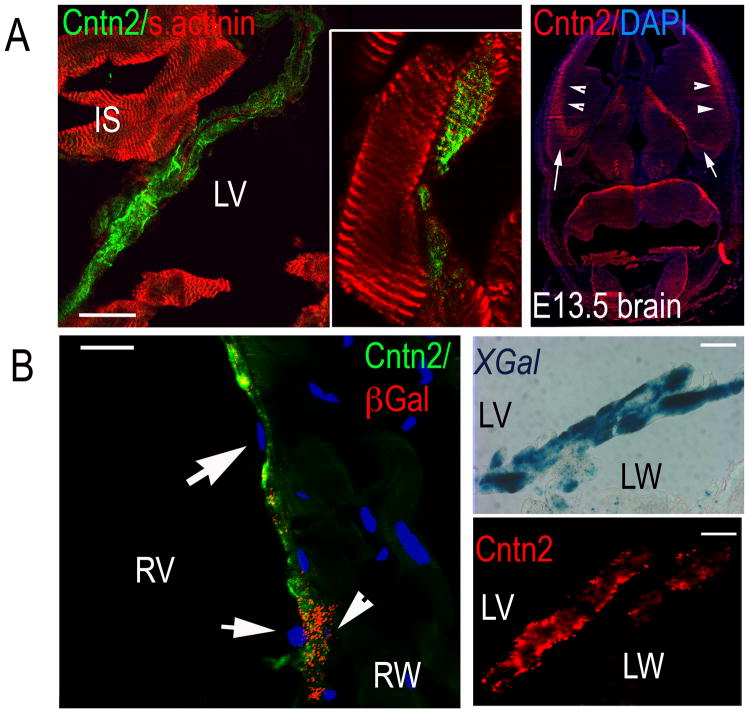
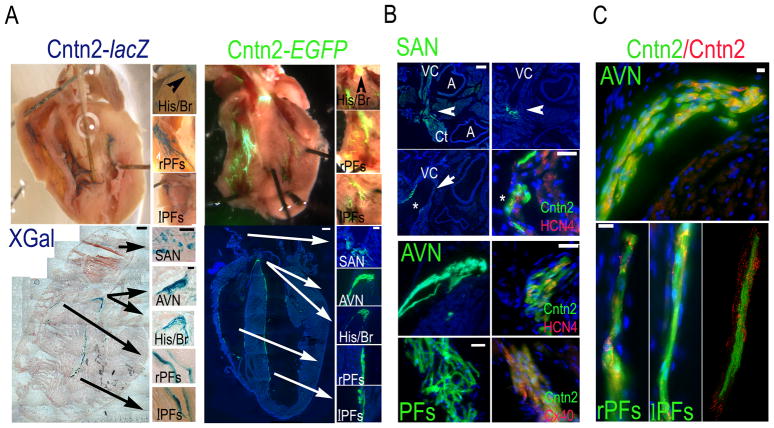
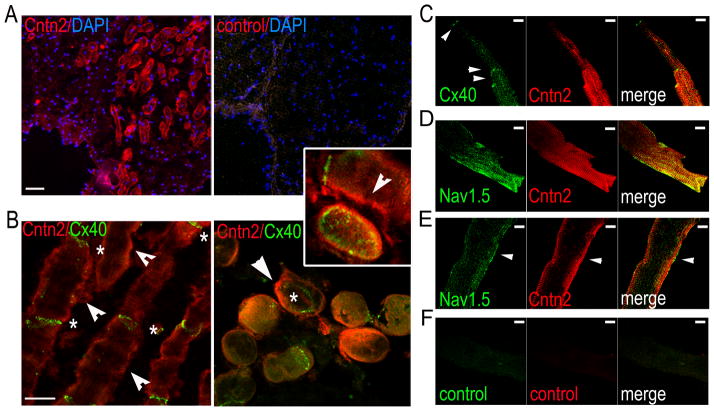
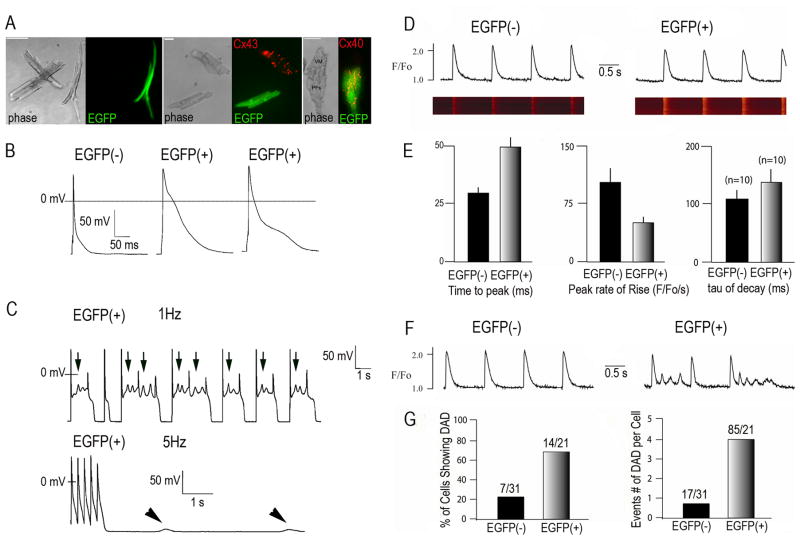
Methods and results: Differential transcriptional profiling of murine Purkinje fibers and working ventricular myocytes was performed to identify novel genes expressed in PCs. The most highly enriched transcript in Purkinje fibers encoded Contactin-2 (Cntn2), a cell adhesion molecule critical for neuronal patterning and ion channel clustering. Endogenous expression of Cntn2 in the murine ventricle was restricted to a subendocardial network of myocytes that also express beta-galactosidase in CCS-lacZ transgenic mice and the connexin40 gap junction protein. Both Cntn2-lacZ knockin mice and Cntn2-EGFP BAC transgenic reporter mice confirmed expression of Cntn2 in the Purkinje fiber network, as did immunohistochemical staining of single canine Purkinje fibers. Whole-cell patch-clamp recordings and measurements of Ca(2+) transients in Cntn2-EGFP(+) cells revealed electrophysiological properties indicative of PCs and distinctive from those of cardiac myocytes, including prolonged action potentials and frequent afterdepolarizations.
Conclusions: Cntn2 is a novel marker of the specialized cardiac conduction system. Endogenous expression of Cntn2 as well as Cntn2-dependent transcriptional reporters provides a new tool through which Purkinje cell biology and pathophysiology can now more readily be deciphered. Expression of a contactin family member within the CCS may provide a mechanistic basis for patterning of the conduction system network and the organization of ion channels within Purkinje cells.
Conflict of interest statement
Figures
Similar articles
-
Unique properties of the ATP-sensitive K⁺ channel in the mouse ventricular cardiac conduction system.Circ Arrhythm Electrophysiol. 2011 Dec;4(6):926-35. doi: 10.1161/CIRCEP.111.964643. Epub 2011 Oct 9. Circ Arrhythm Electrophysiol. 2011. PMID: 21984445 Free PMC article.
-
Purkinje Cells as Sources of Arrhythmias in Long QT Syndrome Type 3.Sci Rep. 2015 Aug 20;5:13287. doi: 10.1038/srep13287. Sci Rep. 2015. PMID: 26289036 Free PMC article.
-
Isolation and characterization of embryonic stem cell-derived cardiac Purkinje cells.Stem Cells. 2015 Apr;33(4):1102-12. doi: 10.1002/stem.1921. Stem Cells. 2015. PMID: 25524238 Free PMC article.
-
Why do we have Purkinje fibers deep in our heart?Physiol Res. 2014;63(Suppl 1):S9-18. doi: 10.33549/physiolres.932686. Physiol Res. 2014. PMID: 24564668 Review.
-
Induction and patterning of the Purkinje fibre network.Novartis Found Symp. 2003;250:142-53; discussion 153-6, 276-9. Novartis Found Symp. 2003. PMID: 12956328 Review.
Cited by
-
Complex Arrhythmia Syndrome in a Knock-In Mouse Model Carrier of the N98S Calm1 Mutation.Circulation. 2020 Nov 17;142(20):1937-1955. doi: 10.1161/CIRCULATIONAHA.120.046450. Epub 2020 Sep 15. Circulation. 2020. PMID: 32929985 Free PMC article.
-
Transcription factor ETV1 is essential for rapid conduction in the heart.J Clin Invest. 2016 Dec 1;126(12):4444-4459. doi: 10.1172/JCI87968. Epub 2016 Oct 24. J Clin Invest. 2016. PMID: 27775552 Free PMC article.
-
Cell junctions in the specialized conduction system of the heart.Cell Commun Adhes. 2014 Jun;21(3):149-59. doi: 10.3109/15419061.2014.905928. Epub 2014 Apr 16. Cell Commun Adhes. 2014. PMID: 24738884 Free PMC article. Review.
-
PCP4 regulates Purkinje cell excitability and cardiac rhythmicity.J Clin Invest. 2014 Nov;124(11):5027-36. doi: 10.1172/JCI77495. Epub 2014 Oct 8. J Clin Invest. 2014. PMID: 25295538 Free PMC article.
-
Enhancing Matured Stem-Cardiac Cell Generation and Transplantation: A Novel Strategy for Heart Failure Therapy.J Cardiovasc Transl Res. 2021 Jun;14(3):556-572. doi: 10.1007/s12265-020-10085-6. Epub 2020 Nov 30. J Cardiovasc Transl Res. 2021. PMID: 33258081 Review.
References
-
- Jay V. The extraordinary career of Dr Purkinje. Arch Pathol Lab Med. 2000;124:662–663. - PubMed
-
- Suma K. Sunao Tawara: a father of modern cardiology. Pacing Clin Electrophysiol. 2001;24:88–96. - PubMed
-
- Scheinman MM. Role of the His-Purkinje system in the genesis of cardiac arrhythmia. Heart Rhythm. 2009;6:1050–1058. - PubMed
-
- Bogun F, Good E, Reich S, Elmouchi D, Igic P, Tschopp D, Dey S, Wimmer A, Jongnarangsin K, Oral H, Chugh A, Pelosi F, Morady F. Role of Purkinje fibers in post-infarction ventricular tachycardia. J Am Coll Cardiol. 2006;48:2500–2507. - PubMed
-
- Hayashi M, Kobayashi Y, Iwasaki YK, Morita N, Miyauchi Y, Kato T, Takano T. Novel mechanism of postinfarction ventricular tachycardia originating in surviving left posterior Purkinje fibers. Heart Rhythm. 2006;3:908–918. - PubMed
Publication types
MeSH terms
Substances
Grants and funding
LinkOut - more resources
Full Text Sources
Molecular Biology Databases
Miscellaneous
