. 2010 Mar 17;29(6):1149-61.
doi: 10.1038/emboj.2010.1. Epub 2010 Jan 28.

Phytaspase, a relocalisable cell death promoting plant protease with caspase specificity

Affiliations

Phytaspase, a relocalisable cell death promoting plant protease with caspase specificity

Nina V Chichkova et al. EMBO J. .

Abstract

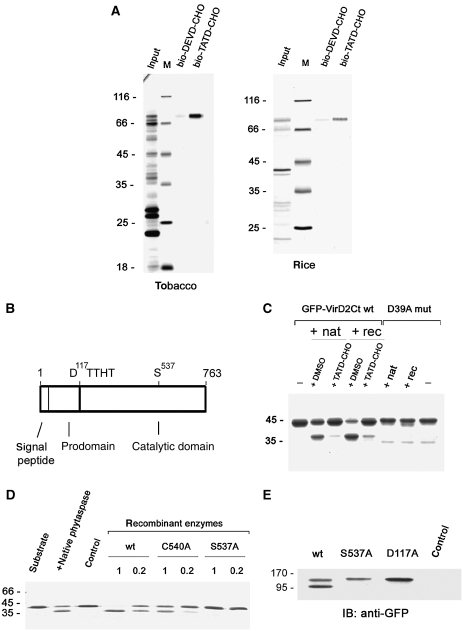
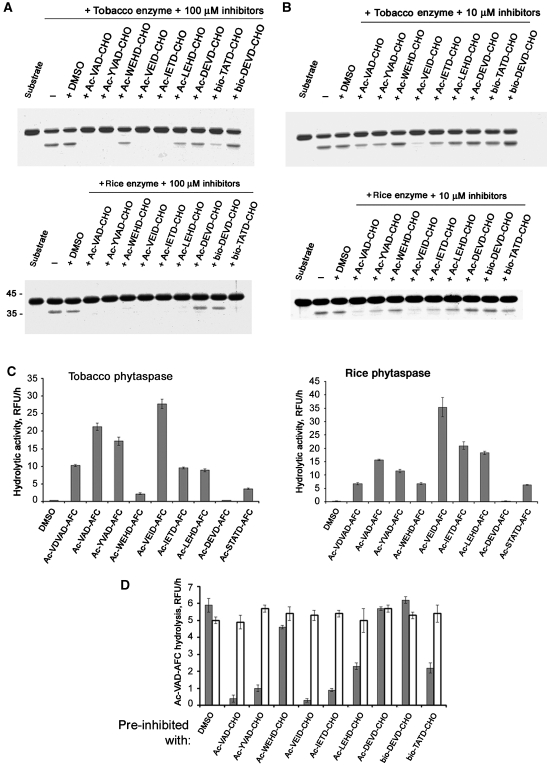
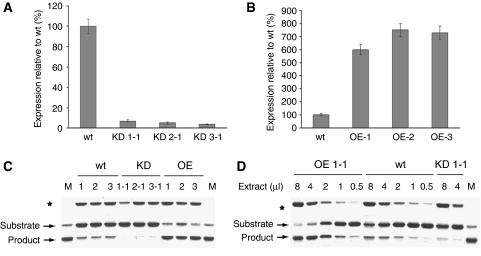
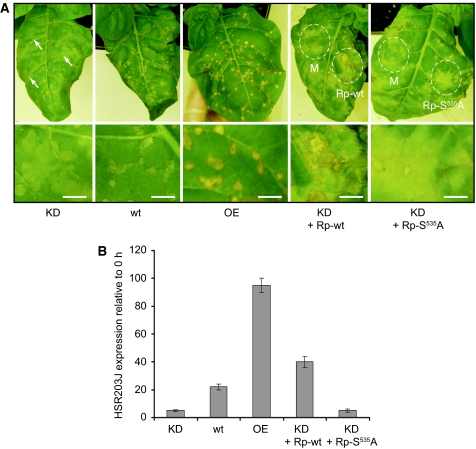
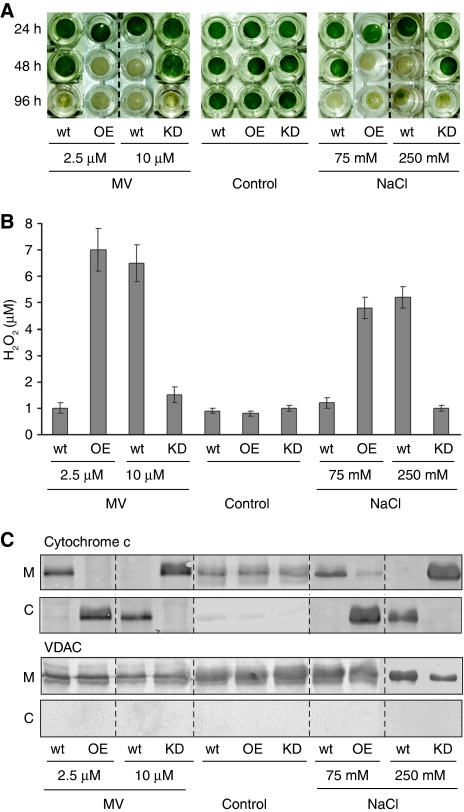
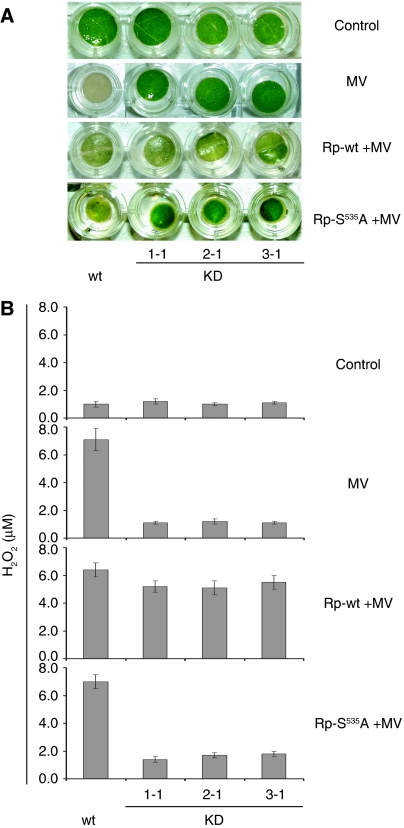
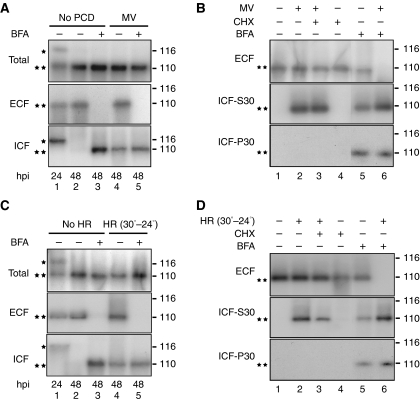
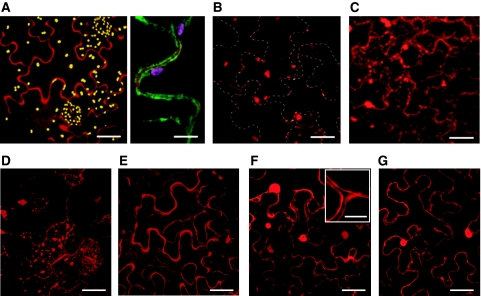
Caspases are cysteine-dependent proteases and are important components of animal apoptosis. They introduce specific breaks after aspartate residues in a number of cellular proteins mediating programmed cell death (PCD). Plants encode only distant homologues of caspases, the metacaspases that are involved in PCD, but do not possess caspase-specific proteolytic activity. Nevertheless, plants do display caspase-like activities indicating that enzymes structurally distinct from classical caspases may operate as caspase-like proteases. Here, we report the identification and characterisation of a novel PCD-related subtilisin-like protease from tobacco and rice named phytaspase (plant aspartate-specific protease) that possesses caspase specificity distinct from that of other known caspase-like proteases. We provide evidence that phytaspase is synthesised as a proenzyme, which is autocatalytically processed to generate the mature enzyme. Overexpression and silencing of the phytaspase gene showed that phytaspase is essential for PCD-related responses to tobacco mosaic virus and abiotic stresses. Phytaspase is constitutively secreted into the apoplast before PCD, but unexpectedly is re-imported into the cell during PCD providing insights into how phytaspase operates.


Conflict of interest statement

The authors declare that they have no conflict of interest.

Figures

Figure 1
Figure 1
Identification and molecular characterisation of tobacco phytaspase. (A) Affinity chromatography purification of tobacco (left panel) and rice (right panel) phytaspases with their inhibitor, bio-TATD-CHO on avidin resin; bio-DEVD-CHO, which does not inhibit phytaspase, was used as a control. Protein samples were fractionated by SDS–gel electrophoresis and stained with Coomassie Blue or zinc-imidazole. Positions of MW protein markers (M) are indicated on the left. (B) Schematic representation of phytaspase domains. (C) Recombinant tobacco phytaspase (rec) displays the same ability to cleave GFP-VirD2Ct protein as natural tobacco enzyme (nat). The bio-TATD-CHO was used at 100 μM for enzyme inhibition. Coomassie Blue-stained gel is shown. The D39A mutation (D39A mut) (Chichkova et al, 2004) preventing cleavage in the GFP-VirD2Ct protein corresponds to the D400 residue in full-length VirD2. (D) The S537A mutation prevents phytaspase-mediated cleavage of GFP-VirD2Ct in vitro (Coomassie Blue staining). C540A, a mutation of a nearby residue, only marginally affects proteolytic activity. Recombinant enzymes were produced as in (C). 1 and 0.2 indicate relative amounts of recombinant enzymes taken to assess their hydrolytic activity, as verified by western blotting with anti-GST antibody. Control sample (control) obtained in an identical manner from vector-only agroinfiltrated leaves. (E) Phytaspase mutants with impaired processing. Western blot analysis of the crude extracts from leaves agroinfiltrated with constructs expressing wt and mutated phytaspase forms fused to GFP with anti-GFP antibody. In contrast to the purified enzyme (A) showing only one band (mature enzyme), extracts containing wt phytaspase display two bands (proenzyme and mature enzyme) apparently because in the latter case, we used immediate denaturation of samples (boiling in SDS). Both the S537A (catalytic residue) and D117A (the prodomain/catalytic domain junction) mutations impair proenzyme processing in N. benthamiana leaves. Control, vector-only agroinfiltrated leaves.
Figure 2
Figure 2
Substrate specificities of tobacco and rice phytaspases. (A) Peptide aldehyde inhibitors of animal caspases at 100 μM, with the exception of DEVD-CHO, impair tobacco (upper panel) and rice (lower panel) phytaspase-mediated fragmentation of GFP-VirD2Ct substrate protein. (B) The use of the same set of inhibitors at 10 μM shows their markedly distinct inhibitory potential and minor differences between tobacco and rice phytaspase specificities. Note that in both cases, Ac-VEID-CHO is the most potent phytaspase inhibitor. (C) Fluorogenic peptide substrates of animal caspases are hydrolysed by tobacco (left panel) and rice (right panel) phytaspases. Relative rates of peptide-AFC (20 μM) hydrolysis expressed as relative fluorescence units per hour (RFU/h, mean values from three samples) are slightly different for rice and tobacco enzymes. Note that the naturally occurring phytaspase cleavage site, STATD, in the VirD2 protein is one of the poorest cleavage sites at the peptide level. (D) Inhibition of phytaspase with peptide aldehyde inhibitors is reversible. Phytaspase was pre-incubated with the indicated inhibitors (at 100 μM), samples were diluted five-fold and fluorogenic substrate Ac-VAD-AFC was added up to 20 μM directly to the mixture to determine relative rates of substrate hydrolysis in the presence of the inhibitors (grey bars). Alternatively, before addition of the fluorogenic substrate, free inhibitors were eliminated by spin gel filtration followed by 1 h incubation at room temperature to allow possible reversion of inhibition (open bars). Data (means from three experiments) are given for tobacco phytaspase. Rice phytaspase behaves similarly (data not shown).
Figure 3
Figure 3
Relative expression of phytaspase ORF in transgenic N. tabacum Samsun NN plants with silenced (knocked down, KD) or overexpressed (OE) phytaspase ORF. (A, B) Phytaspase ORF expression was measured by qRT–PCR in wild-type (wt) plants and in three independent phytaspase-silenced transgenic lines KD1-1, KD2-1 and KD3-1 generated using different RNAi constructs (A) and three independent lines overexpressing phytaspase (B, OE-1, OE-2 and OE-3). The results presented in (A) and (B) were typical of all transgenic lines produced. Data are means±s.d. from six independent plants. The levels of ubiquitin mRNA used as a constitutively expressed internal control were similar in all the samples analysed above (data not shown). (C, D) Transgenic tobacco plants with overexpressed (OE) and silenced (KD) phytaspase display altered phytaspase enzymatic activity relative to wild-type (wt) plants. (C) Crude leaf extracts from three independent OE and KD lines and from wt plants were tested for in vitro cleavage of GFP-VirD2Ct substrate protein. Reaction mixtures were fractionated by 12% SDS–gel electrophoresis. An unknown protein band marked with an asterisk comes from extracts and indicates similar sample loading. Lane M, substrate protein cleaved with purified tobacco phytaspase. (D) Serial dilutions of arbitrary chosen extracts of each type allow quantification of phytaspase enzymatic activity: approximately four-fold increase in OE plants and approximately eight-fold decrease in KD plants, relative to wt plants.
Figure 4
Figure 4
Effects of transgenic phytaspase deficiency or overproduction on PCD in tobacco (Samsun NN) plants induced by TMV. (A) TMV-mediated HR is suppressed in phytaspase-silenced (KD; line KD1-1) plants compared with control (wt) plants, resulting in the formation of less severe amorphous lesions some of which (shown by arrows) continue to grow. The HR in plants overproducing (OE; OE-1 line) phytaspase results in the formation of more severe and sharply defined necrotic lesions. Infected plants were incubated at 30°C for 36 h and then transferred to 24°C. The photographs were taken 12 h after the temperature shift. Heterologous Agrobacterium-mediated expression of the wild-type rice phytaspase gene in the phytaspase-silenced transgenic tobacco leaves (KD + Rp-wt), 24 h before temperature shift led to strengthening of necrotisation, whereas S535 A mutant of phytaspase (KD + Rp-S535A) did not affect the HR phenotype. Areas of agroinfiltration with empty vector (mock), Rp-wt or Rp-S535A constructs are indicated by dashed lines. Lower panels show higher magnification images. Bars are 5 mm. (B) Expression of the HR-specific marker gene HSR203J induced by TMV after the temperature shift is suppressed in phytaspase-silenced (KD; KD1-1 line) plants and is enhanced in phytaspase overproducing (OE; OE-1 line) plants compared with control (wt) plants as shown by qRT–PCR 5 h after the temperature shift. Heterologous expression of the wild-type rice phytaspase gene in the phytaspase-silenced transgenic tobacco leaves (KD + Rp-wt), 24 h before stress treatments led to increase in expression of HSR203J, whereas S535A mutant of phytaspase (KD + Rp-S535A) did not affect HSR203J levels. Data are means±s.d. from three experiments with three independent replicates in each. The levels of ubiquitin mRNA used as an internal control were similar in all of the samples. Data (including photographs) were typical of all generated KD and OE transgenic lines, respectively, tested in, at least, three experiments with three replicates in each.
Figure 5
Figure 5
Effects of transgenic phytaspase deficiency or overproduction on PCD in tobacco (Samsun NN) plants induced by abiotic stresses. (A) Loss of viability (bleaching) of leaf discs, (B) generation of H2O2 and (C) cytochrome c release from mitochondria (M) to cytosol induced by MV or NaCl (versus untreated controls) are facilitated in leaf discs overexpressing phytaspase (OE, OE-1 line) and are suppressed in phytaspase-silenced leaf discs (KD, KD1-1 line) compared with wild type (wt). (A) Leaf discs were immersed in the aqueous solutions of MV or NaCl, or control solution (lacking MV or NaCl) and photographed 24, 48 and 96 h after treatment. (B) H2O2 production was determined 24 h after treatment; data are means±s.d. from three experiments with three independent replicates in each. (C) Western blot analysis of mitochondrial (M) and cytosolic (C) fractions was performed with the cytochrome c monoclonal antibody 24 h after treatment. As a control for cell fractionation, western blots were probed with an anti-VDAC monoclonal antibody. VDAC is localised in the outer membrane of mitochondria (Tsujimoto and Shimizu, 2002). Concentrations of MV and NaCl are indicated. Data (including photographs) were typical of all generated KD and OE transgenic lines, respectively, tested in, at least, three experiments with three replicates in each.
Figure 6
Figure 6
Functional complementation of phytaspase deficiency in methyl viologen (MV)-treated tobacco leaves. (A) Heterologous expression of the wild-type rice phytaspase gene (Rp-wt) in the phytaspase-silenced transgenic tobacco leaves, 24 h before stress treatments led to restoration of the wild-type PCD phenotype as exemplified for MV stress, whereas S535A mutant of phytaspase (KD + Rp-S535A) did not affect viability of leaf discs. Data are shown for three independent RNAi silencing lines (KD1-1, KD2-1 and KD3-1). MV at the concentration of 10 μM induced PCD in wild type (wt), but not in phytaspase RNAi (KD) plants. Photographs were taken 48 h after treatment. (B) Accumulation of H2O2 induced by MV (versus untreated control) was suppressed in phytaspase-silenced leaf discs compared with wild-type leaves and was restored by Agrobacterium-mediated transient expression of wild-type rice phytaspase (Rp-wt), whereas it was unaffected by S535A mutant of phytaspase (Rp-S535A). H2O2 production was determined 24 h after treatment. Data are means±s.d. from three independent experiments with three replicates in each. Data (including photographs) were typical of all generated KD and OE transgenic lines, respectively, tested in, at least, three experiments with three replicates in each.
Figure 7
Figure 7
Localisation (subcellular fractionation) and processing of tobacco phytaspase. (A, B) Subcellular fractionation of phytaspase-mRFP before and after PCD induced by MV. PCD was induced in leaf discs prepared from N. tabacum Samsun NN leaves agroinfiltrated with phytaspase-mRFP construct by immersing in MV solution (10 μM) 42 hpi. (A) BFA was added to discs 24 hpi. (B) BFA and CHX were applied 42 hpi. Plant tissues were fractionated into apoplastic (ECF) and intracellular fractions (ICF, ICF-S30 and ICF-P30) as described in Materials and methods section 24 hpi (A) or 48 hpi (A, B). Concentrations of BFA and CHX were 10 and 100 μg/ml, respectively. Proteins presented in each fraction were analysed by western blot analysis using anti-mRFP antibody. *—and **—protein bands correspond to partially processed (proenzyme lacking the signal peptide, *) and completely processed (mature enzyme lacking the signal peptide and prodomain, **) proteins, as confirmed by Edman degradation sequencing (Supplementary Figure S2). Positions of MW markers are shown on the right. (C, D) Subcellular fractionation of phytaspase-mRFP before and after PCD induced by TMV (HR). N. tabacum Samsun NN leaves simultaneously agroinfiltrated with phytaspase-mRFP and infected with TMV were incubated at 30°C. PCD (HR) in leaf discs prepared from these leaves was induced by temperature shift to 24°C (30−24°C) 42 hpi. (C) BFA was added to discs 24 hpi. (D) BFA and CHX were applied 42 hpi. Plant tissues were fractionated into apoplastic (ECF) and intracellular fractions (ICF, ICF-S30 and ICF-P30) 24 hpi (C) or 48 hpi (C, D) as indicated. For other details see (A) and (B). Data were reproducible over three independent experiments.
Figure 8
Figure 8
Localisation of phytaspase-mRFP in N. tabacum leaves (confocal microscopy). (A) Apoplastic localisation of phytaspase-mRFP. Agrobacterium-mediated expression of phytaspase-mRFP (48 hpi) results in largely apoplastic fluorescence (left panel) as confirmed by co-expression of this construct with the plasma membrane marker EGFP-LT16b, with clear mRFP fluorescence detected outside the cell membrane (right panel). Yellow (left panel) and purple (right panel) granules are chloroplasts showing natural autofluorescence. (B) Inhibition of phytaspase-mRFP secretion by BFA. BFA (10 μg/ml) was infiltrated 24 h after agroinfiltration of the phytaspase-mRFP construct and fluorescence was monitored 24 h later. Phytaspase-mRFP forms aggregates within the cell treated with BFA. Dashed lines show cell borders. (C) Phytaspase-mRFP is partially redistributed into cytoplasm during TMV-mediated HR. N. tabacum plants were simultaneously agroinfiltrated with phytaspase-mRFP construct and infected with TMV at 30°C. HR was induced by temperature shift to 24°C 24 hpi, and fluorescence was monitored 24 h later. (D) Redistribution of phytaspase-mRFP during stress induced by MV (similar redistribution was observed during NaCl-induced PCD). MV (10 μM) was applied 24 hpi, and fluorescence was monitored 24 h later (E) Apoplastic localisation of cathepsin B (Gilroy et al, 2007) is retained after stress treatment exemplified here with MV. Cathepsin B-mRFP fusion construct was agroinfiltrated into N. tabacum leaves and MV was applied 24 hpi. Fluorescence was monitored 24 h later. (F, G) Intracellular (presumably cytoplasmic and nuclear) localisation of free mRFP (used as an additional control) expressed from Agrobacterium in untreated N. tabacum leaves (F) was not changed during MV-induced PCD (G). Insert in (F) clearly shows unlabelled (by free mRFP) apoplastic space close to cell junctions. Of note, intracellular localisation of free mRFP (F, G) was different from that of phytaspase–mRFP under stress conditions (C, D). Scale bars are 15 μm [A-left panel, B, C, D, E, F (apart from insert) and G], 50 μm (A-right panel and insert (in F).

References

    1. Abramoff MD, Magelhaes PJ, Ram SJ (2004) Image processing with ImageJ. Biophotonics Internat 11: 36–42
    1. Affenzeller MJ, Darehshouri A, Andosch A, Lütz C, Lütz-Meindl U (2009) Salt stress-induced cell death in the unicellular green alga Micrasterias denticulata. J Exp Bot 60: 939–954 - PMC - PubMed
    1. Balk J, Leaver CJ (2001) The PET1-CMS mitochondrial mutation in sunflower is associated with premature programmed cell death and cytochrome c release. Plant Cell 13: 1803–1818 - PMC - PubMed
    1. Bassham DC (2007) Plant autophagy-more than a starvation response. Curr Opin Plant Biol 10: 587–593 - PubMed
    1. Boatright KM, Salvesen GS (2003) Mechanisms of caspase activation. Curr Opin Cell Biol 15: 725–731 - PubMed

Publication types