. 2010 Feb 17;29(4):843-54.
doi: 10.1038/emboj.2009.389. Epub 2010 Jan 28.

Kinesin-1/Hsc70-dependent mechanism of slow axonal transport and its relation to fast axonal transport

Affiliations

Kinesin-1/Hsc70-dependent mechanism of slow axonal transport and its relation to fast axonal transport

Sumio Terada et al. EMBO J. .

Abstract

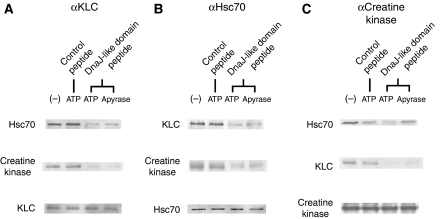
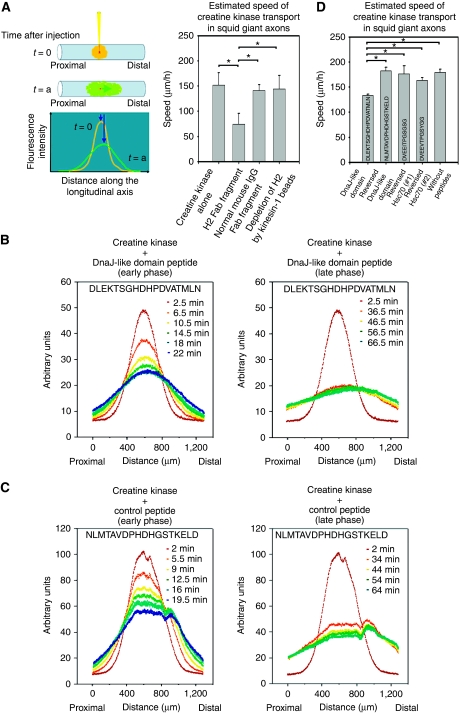
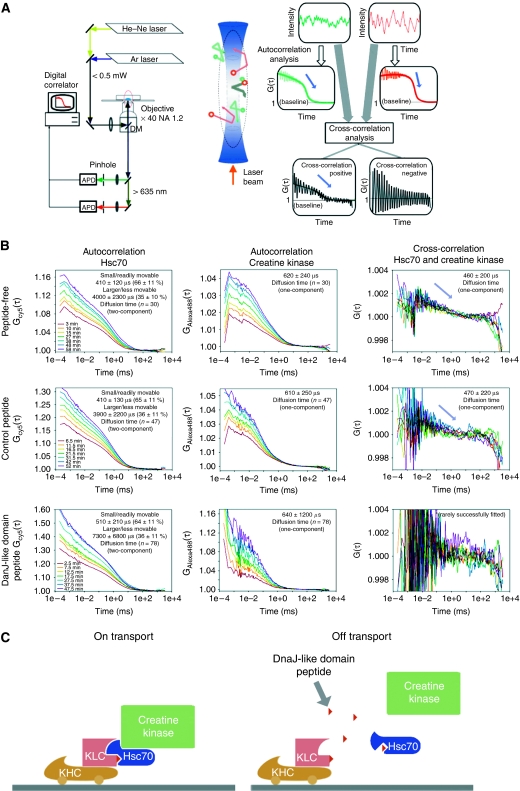
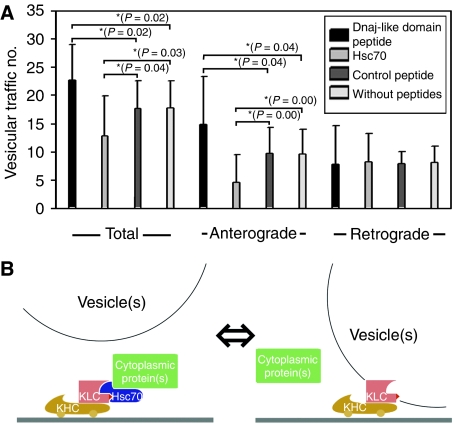
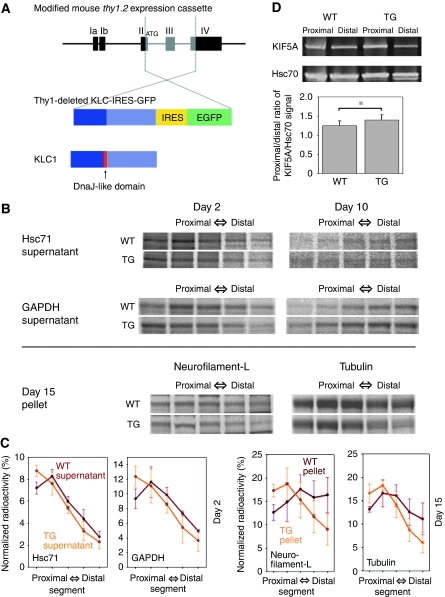
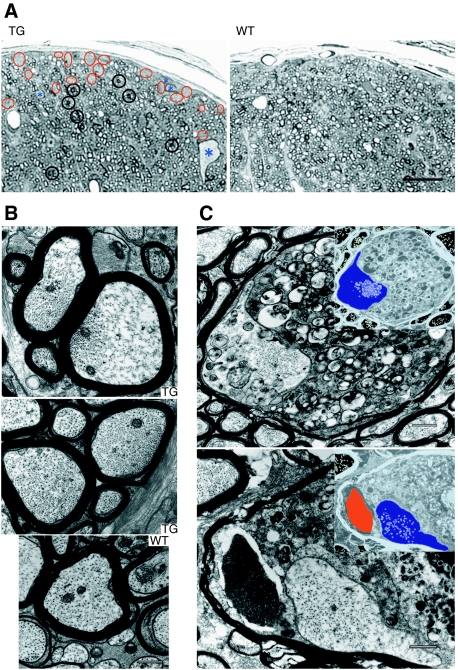
Cytoplasmic protein transport in axons ('slow axonal transport') is essential for neuronal homeostasis, and involves Kinesin-1, the same motor for membranous organelle transport ('fast axonal transport'). However, both molecular mechanisms of slow axonal transport and difference in usage of Kinesin-1 between slow and fast axonal transport have been elusive. Here, we show that slow axonal transport depends on the interaction between the DnaJ-like domain of the kinesin light chain in the Kinesin-1 motor complex and Hsc70, scaffolding between cytoplasmic proteins and Kinesin-1. The domain is within the tetratricopeptide repeat, which can bind to membranous organelles, and competitive perturbation of the domain in squid giant axons disrupted cytoplasmic protein transport and reinforced membranous organelle transport, indicating that this domain might have a function as a switchover system between slow and fast transport by Hsc70. Transgenic mice overexpressing a dominant-negative form of the domain showed delayed slow transport, accelerated fast transport and optic axonopathy. These findings provide a basis for the regulatory mechanism of intracellular transport and its intriguing implication in neuronal dysfunction.


Conflict of interest statement

The authors declare that they have no conflict of interest.

Figures

Figure 1
Figure 1
Co-immunoprecipitation of KLC/Hsc70/creatine kinase complex in sciatic nerve preparation. Co-immunoprecipitation results using anti-KLC (A), Hsc70 (B) and creatine kinase (C) antibodies are shown, combined with experimental conditions on KLC DnaJ-like domain peptide fragment of KLC, ATP, apyrase or reversed DnaJ-like domain control peptide addition.
Figure 2
Figure 2
DnaJ-like domain peptide of KLC and the creatine kinase transport in squid giant axons. (A) Injection of labelled creatine kinase into squid giant axons and monitoring of the profile movement. The movement is blocked by anti-Kinesin-1 antibody. After injection (t=0), the fluorescent signal profile was measured time sequentially (t=a) along the longitudinal axis of the axon. Each profile was fitted with Gaussian curve, and the transporting speed of its gravity centre was estimated. The transporting profile moved anterogradely (note that the right direction is distal). Anti-Kinesin-1 antibody inhibits creatine kinase transport in the early phase. Each bar shows standard deviation. Estimated average speeds±standard deviation: creatine kinase alone, 151.3±24.4 μm/h (n=4); functional blocking antibody (Fab fragment) against Kinesin-1 (H2, 0.4 mg/ml), 74.2±21.1 μm/h (n=4); control normal mouse IgG Fab fragment, 140.5±11.5 μm/h (n=4); depletion of H2 Fab fragment by recombinant Kinesin-1 beads, 143.7±26.6 μm/h (n=4). All P-values of the pairs with asterisks are 0.00<0.05, Mann–Whitney tests. (B, C) Co-injection of a DnaJ-like domain peptide (B) or control peptide (C) with creatine kinase and monitoring of the profile movements. The early phases (<30 min) after the injection are on the left, whereas the late phases (30–70 min) are on the right. (D) DnaJ-like domain peptide inhibits creatine kinase transport in the early phase. Each bar shows standard deviation. Estimated average speeds±standard deviation: DnaJ-like domain peptide, 133.1±2.3 μm/h (n=4); reversed sequence of DnaJ-like domain peptide fragment, 182.4±7.0 μm/h (n=5); reversed sequence of the carboxy terminal of Hsc70 (#1), 176.1±16.0 μm/h (n=4); reversed sequence of the carboxy terminal of Hsc70 (#2), 163.2±5.0 μm/h (n=4); creatine kinase alone without peptides, 179.2±6.2 μm/h (n=4), P=0.032 (DnaJ-like domain peptide and reversed DnaJ-like domain peptide); 0.029 (DnaJ-like domain peptide and reversed Hsc70 #1 peptide), 0.029 (DnaJ-like domain peptide and reversed Hsc70 #2 peptide); 0.032 (DnaJ-like domain peptide and creatine kinase alone). All P-values <0.05, Mann–Whitney tests. Peptide sequence used in each case is indicated in the bar.
Figure 3
Figure 3
FCCS analysis of the creatine kinase transporting complex in squid giant axons. (A) (Left) Block diagram of the FCCS setup. Injected axons are excited with laser beams, and emission light is detected by an avalanche photodiode (APD). Fluctuations in the fluorescent signals are analysed using a digital correlator system. DM, dichroic mirror. (Middle) Schematic diagram of the FCCS measuring volume. The circular marks (green and red) represent Brownian movement of the fluorescent molecules. The movements of associated green and red marks are shown in grey. (Right) Schematic time trace of the fluorescence fluctuation (upper), calculated autocorrelation function (middle) and cross-correlation (lower) of fluorescent molecules in the measuring volume. Fitting lines with theoretical equations are indicated as smooth lines. (B) Three representative sets of correlation curves from three different axons (upper, middle and lower columns), indicating examples of simultaneous time-series measurement of Hsc70/creatinine kinase autocorrelations and their cross-correlation. Measured correlation curves in axons in peptide-free (upper), control peptide-containing (middle) and DnaJ-like domain peptide-containing (lower) conditions. The left, middle and right panels show the results for Hsc70, creatine kinase and the cross-correlation, respectively. (C) Direct relevance to the slow axonal transport system and deduced function of the Hsc70-KLC interaction. (Left) Scaffolding function of Hsc70 between KLC and creatine kinase. (Right) A peptide fragment of the DnaJ-like domain of KLC (red small triangle) disrupts creatine kinase transport by disrupting the cargo and motor interaction. The peptide competes the association between Hsc70 and KLC, thus disrupting the interaction between them. Dissociated Hsc70 is converted into the ATP form, thus releasing cytosolic protein(s). KHC: kinesin heavy chain (Kinesin-1).
Figure 4
Figure 4
DnaJ-like domain peptide treatment and vesicular transport in squid giant axons. (A) The number of vesicles passing across the fixed line with a unit length (10 μm) for 1 min, both antero- and retrogradely in VEC-DIC images. (Left) Total vesicular traffic (both antero- and retrograde transport) was promoted by DnaJ-like domain peptide application, and inhibited by Hsc70 treatment, when compared with control peptide applied or untreated specimen. (Middle) Anterograde vesicular traffic was increased in the presence of DnaJ-like domain peptide, and inhibited by Hsc70 in the same way as the cases shown in the left column. (Right) Retrograde vesicular traffic was not affected by peptide or Hsc70 treatments. Bars indicate standard deviations. Pairs with asterisk indicate their P-values are <0.05 (Mann–Whitney tests, n=16 for each). (B) DnaJ-like domain of KLC serves to anchor KLC to Hsc70. (Left) Slow axonal transport mode. By associating with DnaJ-like domain in the TPR of KLC, activated Hsc70 binds to cytoplasmic proteins. (Right) Fast axonal transport mode. The same domain binds to a membranous vesicle.
Figure 5
Figure 5
Transgenic mice generation and axonal transport analysis in their optic nerve axons. (A) Vector construction for the transgenic mice. Thy1-deleted KLC-IRES-GFP expresses KLC in which the DnaJ-like domain is deleted and GFP bicistronically under the control of the thy1.2 promoter. (B) Slow axonal transport profile analysed by metabolic-labelling studies. We injected 35S methionine into the vitreous bodies of mouse eyeballs. After 2, 10 or 15 days, consecutive serial segments of the optic nerves were processed. WT (upper panels) and TG (lower panels) show the results for the wild-type and transgenic mice, respectively. The results of supernatants of Hsc71 and GAPDH at day 2/10 and pellets of neurofilament (L; low-molecular weight) and tubulin at day 15 are shown. (C) Profiles of specific bands based on the results shown in (B). Bars show the standard deviation. (D) Fast axonal transport analysed by sciatic nerve ligation studies. We ligated sciatic nerves, and 6 h later, collected nerve segments (3 mm) proximal and distal to the ligature. Sciatic nerve segments were analysed by western blot. WT (left panels) and TG (right panels) show the results for the wild-type and transgenic mice, respectively. The proximal/distal ratios of KIF5A (fast axonal marker)/Hsc70 (internal control) signal were 1.254±0.123 (n=8) for wild-type mice and 1.404±0.135 (n=8) for transgenic mice.
Figure 6
Figure 6
Deteriorated axonal cytoarchitecture and ‘dying-back' oligodendrogliopathy with late-onset axonal degeneration in transgenic mice. (A) Semi-thin sections of the transgenic mice stained with toluidine blue. Degenerating axons as accumulating darkly stained structures (black circles) and patches of empty space without axons in the peripheral areas (red circles) are prominent in transgenic mice (TG). Abnormally giant swollen axons (asterisks) that we never encounter in wild-type littermate (WT) are conspicuous in the dorsal compartment of optic nerves. Bar: 20 μm. (B) The slightly dilated axons in transgenic mice (TG) show a biased distribution of microtubules in the axoplasm, compared with wild-type mice (WT). Bar: 500 nm. (C) ‘Dying-back' oligodendrogliopathy of optic nerves, showing atrophic axoplasm (depicted in blue in the negatives), and the severely degenerated and swollen periaxoplasmic inner loop of oligodendroglia. In the lower panel, note the crystalline inclusions within the degenerating inner loop (depicted in red in the negative) of oligodendroglia. Bars: 500 nm.

References

    1. Adachi H, Katsuno M, Minamiyama M, Sang C, Pagoulatos G, Angelidis C, Kusakabe M, Yoshiki A, Kobayashi Y, Doyu M, Sobue G (2003) Heat shock protein 70 chaperone overexpression ameliorates phenotypes of the spinal and bulbar muscular atrophy transgenic mouse model by reducing nuclear-localized mutant androgen receptor protein. J Neurosci 23: 2203–2211 - PMC - PubMed
    1. Aihara M, Lindsey JD, Weinreb RN (2002) Reduction of intraocular pressure in mouse eyes treated with latanoprost. Invest Ophthalmol Vis Sci 43: 146–150 - PubMed
    1. Andra K, Abramowski D, Duke M, Probst A, Wiederhold KH, Burki K, Goedert M, Sommer B, Staufenbiel M (1996) Expression of APP in transgenic mice: a comparison of neuron-specific promoters. Neurobiol Aging 17: 183–190 - PubMed
    1. Auluck PK, Chan HY, Trojanowski JQ, Lee VM, Bonini NM (2002) Chaperone suppression of alpha-synuclein toxicity in a Drosophila model for Parkinson's disease. Science 295: 865–868 - PubMed
    1. Baas PW, Brown A (1997) Slow axonal transport: the polymer transport model. Trends Cell Biol 7: 380–384 - PubMed

Publication types

MeSH terms