. 2010 Jan 25;5(1):e8699.
doi: 10.1371/journal.pone.0008699.

RNA microarray analysis in prenatal mouse cochlea reveals novel IGF-I target genes: implication of MEF2 and FOXM1 transcription factors

Affiliations

RNA microarray analysis in prenatal mouse cochlea reveals novel IGF-I target genes: implication of MEF2 and FOXM1 transcription factors

Hortensia Sanchez-Calderon et al. PLoS One. .

Abstract

Background: Insulin-like growth factor-I (IGF-I) provides pivotal cell survival and differentiation signals during inner ear development throughout evolution. Homozygous mutations of human IGF1 cause syndromic sensorineural deafness, decreased intrauterine and postnatal growth rates, and mental retardation. In the mouse, deficits in IGF-I result in profound hearing loss associated with reduced survival, differentiation and maturation of auditory neurons. Nevertheless, little is known about the molecular basis of IGF-I activity in hearing and deafness.

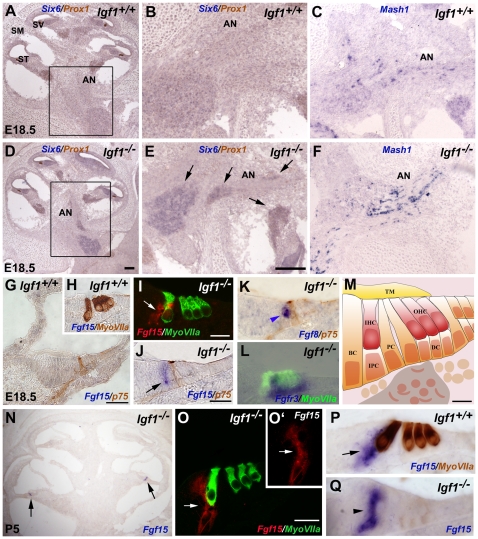
Methodology/principal findings: A combination of quantitative RT-PCR, subcellular fractionation and Western blotting, along with in situ hybridization studies show IGF-I and its high affinity receptor to be strongly expressed in the embryonic and postnatal mouse cochlea. The expression of both proteins decreases after birth and in the cochlea of E18.5 embryonic Igf1(-/-) null mice, the balance of the main IGF related signalling pathways is altered, with lower activation of Akt and ERK1/2 and stronger activation of p38 kinase. By comparing the Igf1(-/-) and Igf1(+/+) transcriptomes in E18.5 mouse cochleae using RNA microchips and validating their results, we demonstrate the up-regulation of the FoxM1 transcription factor and the misexpression of the neural progenitor transcription factors Six6 and Mash1 associated with the loss of IGF-I. Parallel, in silico promoter analysis of the genes modulated in conjunction with the loss of IGF-I revealed the possible involvement of MEF2 in cochlear development. E18.5 Igf1(+/+) mouse auditory ganglion neurons showed intense MEF2A and MEF2D nuclear staining and MEF2A was also evident in the organ of Corti. At P15, MEF2A and MEF2D expression were shown in neurons and sensory cells. In the absence of IGF-I, nuclear levels of MEF2 were diminished, indicating less transcriptional MEF2 activity. By contrast, there was an increase in the nuclear accumulation of FoxM1 and a corresponding decrease in the nuclear cyclin-dependent kinase inhibitor p27(Kip1).

Conclusions/significance: We have defined the spatiotemporal expression of elements involved in IGF signalling during inner ear development and reveal novel regulatory mechanisms that are modulated by IGF-I in promoting sensory cell and neural survival and differentiation. These data will help us to understand the molecular bases of human sensorineural deafness associated to deficits in IGF-I.


Conflict of interest statement

Competing Interests: The authors have declared that no competing interests exist.

Figures

Figure 1
Figure 1. Igf1 and Igf1r mRNA expression in the cochlea.
(A–C) Cartoons of the organ of Corti at E15.5, E18.5 and P5 show the expression of Igf1 (blue), Igf1r (orange and red) or both (purple). (D–O) In situ hybridization of Igf1 (D-I,I') and Igf1r (J-O, O') in normal embryos at E15.5 (D,G,J,M), E18.5 (E,H,K,N) and in P5 mice (F,I,L,O). Dual immunostaining with anti-Kir4.1 was performed to identify the neural projections, the stria vascularis and pillar cells (F,I,I') and with anti-Prox1 to identify the pillar cells, Deiter's cells, and auditory neurons (J–O,O'). (D-I) Igf1 expression was located in the stria vascularis (long black arrows), spiral limbus (black arrowheads), outer sulcus (green arrowheads) and Reissner's membrane (short black arrow). At P5 the Igf1 expression in the stria vascularis was observed in the marginal cells (I'). (J,K,M,N) At E15.5 and E18.5, Igf1r was strongly expressed in the GER (red arrow) and weakly in the LER (red arrowhead). (L,O) At P5, Igf1r expression presented a complementary pattern to that of Igf1 and was observed within the inner spiral sulcus (red arrows), Claudius and Hensen's cells (red arrowheads). Igf1r was also located in the AG (asterisk in J,K, K') and in the basal cells of the stria vascularis (O'). Three embryos per genotype were tested in parallel in three independent experiments. GER, greater epithelial ridge; IHC, inner hair cells; LER, lesser epithelial ridge; OHC, outer hair cells; PC, pillar cells; AG, auditory ganglion; SM, scale media; ST, scala tympani; SV, scala vestibuli; TM, tectorial membrane. Scale Bars: D,E,F, 150 µm (D,E,F,J,K,L); A,B,C, 50 µm; G,H,I, 50 µm (G,H,I,M,N,O); I', 10 µm; O', 20 µm and K', 30 µm.
Figure 2
Figure 2. Time-course of mRNA expression of IGF-system genes and the activation levels of signalling mediators in the E18.8 cochlea.
(A–D) mRNA expression levels of Igf1, Igf1r, Igfbp2 and Igfbp3 were analyzed by qRT-PCR in Igf1+/+ (open circles) and Igf1−/− (closed circles) mice at E15.5 and E18.5 (n = 8), P5, P15, P30, P60 and P90 (n = 6). Eukaryotic 18S rRNA was used as the endogenous housekeeping control gene. The estimated gene expression was calculated as 2−ΔCt·106. (A) Igf1 expression was high in normal cochlea and absent in the null mice. (B) Igf1r expression in normal cochleae decreased dramatically from E15.5 to P5 and increased with age thereafter. In the Igf1−/− cochlea, Igf1r followed the same pattern but consistently presented higher levels at all time points studied. Igfbp2 (C) and Igfbp3 (D) mRNA levels were high at E15.5 but they dropped thereafter. Their profiles were slightly higher in the Igf1−/− cochlea. (E) IGF-I modulates IGF1R, ERK, Akt and p38 activation at E18.5. (F) Levels of phosphorylated-IGF1R and IRS2 in cochlear protein extracts from Igf1+/+ and Igf1−/− mice were studied by Western blotting at E15.5, E18.5, P5, P60 and P90. Data are presented as percentage of Igf1−/− null mouse protein levels compared to the Igf1+/+. (G) To determine the levels of phosphorylated AktSer473, ERK and p38 MAPK, cochlear protein extracts from E18.5 Igf1+/+ and Igf1−/− mice were analysed by immunoblotting. Membranes were re-probed with β-Actin as a loading control, and for the non-phosphorylated forms of AKT and ERK1/2. Films were scanned, densitometry performed by using ImageJ software and the levels were normalised by giving a value of 100 to the Igf1+/+ mouse samples. Values are presented as mean±SEM of at least 3 different experiments involving at least 6 mice per condition for Akt, ERK and p38 MAPK. The statistical significance estimated by Student's t-test was as follows ***p<0.005; **p<0.01; *p<0.05.
Figure 3
Figure 3. Up-regulation of Six6, Mash1 and Fgf15 in the embryonic cochlea of the Igf1−/− mouse.
In situ hybridization for Six6 (A, B, D, E), Mash1 (C, F) Fgf15 (G–J and N–Q), Fgf8 (K) and FgfR3 (L) transcripts was performed on cryostat sections from Igf1+/+ and Igf1−/− E18.5 (A–F and G–M) and P5 (N–Q) cochleas. (M) Schematic drawing of the organ of Corti showing the different cell types at E18.5. Six6 and Mash1 expression was higher in the auditory nerve (AN) of E18.5 Igf1−/− cochlea. Fgf15 mRNA expression located in the border cells (BC) and in the inner phalangeal cells (IPC) of E18.5 Igf1−/− mice (arrows in I,J), was absent in Igf1+/+ mice (G,H). Fgf8 (blue arrowhead in K) expression was detected in IHC in Igf1−/− and FgfR3 (blue staining in L) transcripts were also detected in Igf1−/− supporting cells. At P5, Fgf15 expression was observed in the IPC and BC in the basal turn of the cochlea of both Igf1−/− (arrows in N,O,O',P) and normal (arrowhead in Q) mice. Immunostaining for Prox1 (brown in A,B,D,E), MyosinVIIa (brown in H,P green in I,L,O) and p75 (brown in G,J,K) identified supporting cells, inner and outer hair cells and pillar cells respectively. Three embryos per genotype were tested in parallel in three independent experiments. DC, Deiter's cells; HC, hair cells; IHC, inner hair cells; OHC, outer hair cells; PC, pillar cells; SM, scala media; ST, scala tympani; SV, scala vestibuli; TM, tectorial membrane. Scale Bars: A, 100 µm (A,D,N); E, 100 µm (B, C, E, F); 50 µm (G); I, 20 µm (I,O,O'); and 30 µm (H,J,K,L,P,Q); M, 10 µm.
Figure 4
Figure 4. Time-course of IGF-I target gene mRNA expression.
qRT-PCR analysis of mRNA from Igf1+/+ (open circles) and Igf1−/− (closed circles) cochleae obtained at E15.5, E18.5, P5, P15, P30, P60 and P90. Eukaryotic 18S rRNA was used as the endogenous housekeeping control gene. Estimated gene expression levels are represented as 2−ΔCt·106. Fgf15 (A) and Dnabj7 (B) expression profiles were similar, with high levels at E15.5 and lower levels from E18.5 onwards. Up to P5, more Fgf15 transcripts and fewer Dnabj7 transcripts were detected in the mutant cochlea. Shbg levels were higher from P5 onwards (C) whilst Retnla (D) expression increased with age. Although weaker in the Igf1−/− cochlea, Ush1c (E) mRNA levels were higher in the Igf1−/− cochlea and Kcnd2 levels were lower from P15 onwards (F). Statistical significance estimated by Student's t-test was as follows ***p<0.005; **p<0.01; *p<0.05, with respect to wild type mice data (n = 6 mice/genotype).
Figure 5
Figure 5. IGF-I deficiency modifies FoxM1 and p27Kip1 levels and intracellular localization.
(A) Cytoplasmic and nuclear fractions of protein extracts obtained from at least 12 different E18.5 or P15 Igf1+/+ or Igf1−/− mouse cochleas in at least six different experiments were immunoblotted to detect the presence of FoxM1 and p27Kip1. Blots were reprobed with β-actin (cytoplasmic fraction) or histone H3 (nucleus) as loading controls. The specific bands were measured by densitometry to determine the average expression with ImageJ software. Results were normalized by assigning a value of 100 to the cytoplasmic Igf1+/+ and represented graphically in (B). (C) Relative quantification value (RQ) of Foxm1 expression in the Igf1−/− cochlea compared to Igf1+/+, estimated by qRT-PCR at E15.5, E18.5-P5 and P15-P90. Data are presented as log10RQ average. (D–M) Localization of immunostaining for FoxM1 in the P15 Igf1+/+ (D–H) and Igf1−/− (I–M) mouse cochlea. The expression was located in the AG, the stria vascularis and the organ of Corti (white arrows). Statistical significance estimated with the Student's t-test was: ***p<0.005; **p<0.01; *p<0.05, of mutant versus wild type mice data. Open and closed bars: Igf1+/+ and Igf1−/− mice, respectively. Cyt, cytoplasm; Nuc, nucleus; AG, auditory ganglia, IHC, inner hair cell; OC, organ of Corti; OHC, outer hair cell; SM, scala media. Scale bars: D, 100 µm (D,I); E, 20 µm (E,F,J,K) and G, 20 µm (G, H, L, M).
Figure 6
Figure 6. IGF-I deficiency modifies MEF2 levels and intracellular localization.
(A) Cytoplasmic and nuclear fractions of protein extracts obtained from E18.5 and P15 normal or Igf1−/− mouse cochleae (n = 21, from at least 7 different experiments) were immunoblotted to detect the presence of MEF2A and MEF2D. Blots were re-probed with β-Actin (cytoplasmic fraction) or histone H3 (nucleus) as loading controls. The specific bands were measured by densitometry (ImageJ software) to determine the average expression. Results were normalized respect to β-actin or histone, a value of 100 was assigned to the scanned intensity of cytoplasmic forms in Igf1+/+ and represented graphically in (B,C). (D) Mef2a, Mef2c and Mef2d expression was measured by qRT-PCR at E15.5, E18.5-P5 and P15-P90 data points in the Igf1−/− mouse cochleas and compared with the Igf1+/+. Data are presented as the mean of log10RQ. Statistical significance estimated with Student's t-test was: ***p<0.005; **p<0.01; *p<0.05. Open bars: Igf1+/+ mouse; Closed bars: Igf1−/− mouse. Cyt, cytoplasm; Nuc, nucleus, β-act, β-actine; H3, histone 3.
Figure 7
Figure 7. MEF2A and MEF2D immunolocalization in the cochlea of Igf1+/+ and Igf1−/− mice.
MEF2A expression in the cochlea of E18.5 (A,B,C) and P15 (I,J,K,L,M) Igf1+/+ (A,B,I,J) and Igf1−/− (C,K) mice. At E18.5, MEF2A strongly stained the nuclei in the Igf1+/+ auditory ganglion (arrowheads in B), whereas fewer nuclei appeared labelled in the Igf1−/− ganglia (arrowheads in C) where the staining appeared more cytoplasmatic. At P15, labelling was similar in the neurones (J,K), Deiter's cells, pillar cells and in the IHC (L,M) of both genotypes. MEF2D expression at E18.5 was shown in the auditory ganglia (E,F) and organ of Corti (G,H). MEF2D expression was less nuclear in the Igf1−/− (F, arrowheads pointing to unlabelled nuclei, H) than in the wild type mouse (E,G). At P15, MEF2D expression was observed in the nuclei of auditory neurons (N) and in the IHC (P,P') in the Igf1+/+ but not in the Igf1−/− mouse (O,Q). AG, auditory ganglion; IHC, inner hair cells; OHC, outer hair cells; SM, scale media; ST, scala tympani; SV, scala vestibule. Scale bars:. A, 100 µm; B, 25 µm (B,C,E,F); D, 75 µm; I, 100 µm; G, 20 µm (G,H); J, 20 µm (J,K); L, 20 µm (L,M); N, 20 µm (N,O); P, 20 µm (P,P',Q).
Figure 8
Figure 8. Differentially expressed genes in the IGF-I-deficient cochlea.
Names of selected differentially expressed genes (red) are shown on a schematic drawing of the adult scala media. BC, border cells; BsC, basal cells; BM, basilar membrane; CC, Claudius's cells; DC, Deiter's cells; HC, Hensen's cells; IC, intermediate cells; IDC, interdental cells; IHC, inner hair cells; IPC, inner phalangeal cells; IS, inner sulcus; Li, spiral limbus; MC, marginal cells; OHC, outer hair cells; PC, pillar cells; RM, Reisner's membrane; AG, auditory ganglion; SL, spiral ligament; SM, scala media; ST, scala tympani; SV, scala vestibuli; TM, tectorial membrane.

Similar articles

Cited by

References

    1. Piper MD, Selman C, McElwee JJ, Partridge L. Separating cause from effect: how does insulin/IGF signalling control lifespan in worms, flies and mice? J Intern Med. 2008;263:179–191. - PubMed
    1. Russo VC, Gluckman PD, Feldman EL, Werther GA. The insulin-like growth factor system and its pleiotropic functions in brain. Endocr Rev. 2005;26:916–943. - PubMed
    1. Werner H, Weinstein D, Bentov I. Similarities and differences between insulin and IGF-I: structures, receptors, and signalling pathways. Arch Physiol Biochem. 2008;114:17–22. - PubMed
    1. Joseph D'Ercole A, Ye P. Expanding the mind: insulin-like growth factor I and brain development. Endocrinology. 2008;149:5958–5962. - PMC - PubMed
    1. LeRoith D. Insulin-like growth factors and the brain. Endocrinology. 2008;149:5951. - PubMed

Publication types

MeSH terms