

Macrophage plasticity in experimental atherosclerosis
- PMID: 20111605
- PMCID: PMC2810335
- DOI: 10.1371/journal.pone.0008852
Macrophage plasticity in experimental atherosclerosis
Abstract
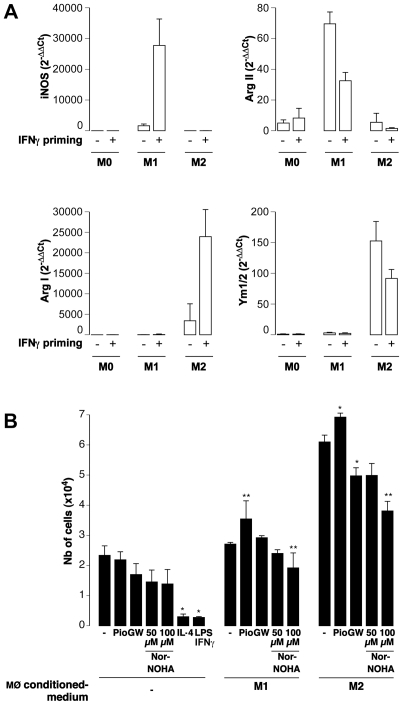
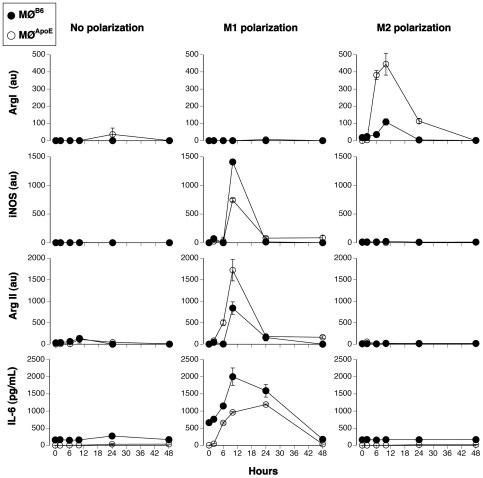
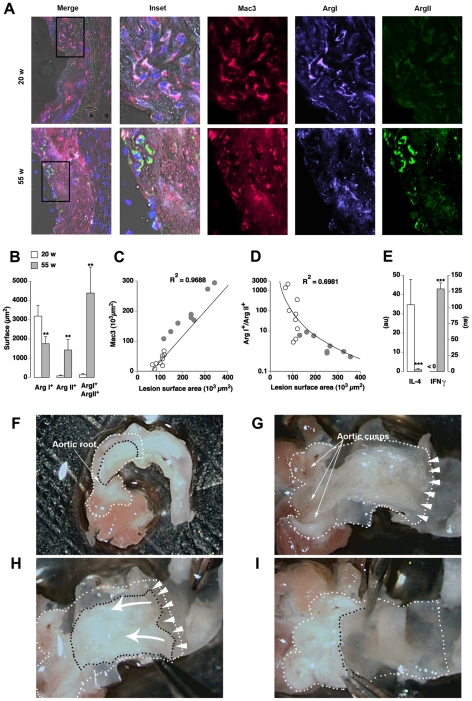
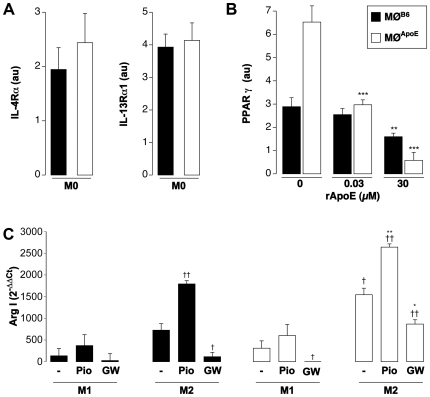
As in human disease, macrophages (MØ) are central players in the development and progression of experimental atherosclerosis. In this study we have evaluated the phenotype of MØ associated with progression of atherosclerosis in the apolipoprotein E (ApoE) knockout (KO) mouse model.We found that bone marrow-derived MØ submitted to M1 and M2 polarization specifically expressed arginase (Arg) II and Arg I, respectively. This distinct arginase expression was used to evaluate the frequency and distribution of M1 and M2 MØ in cross-sections of atherosclerotic plaques of ApoE KO mice. Early lesions were infiltrated by Arg I(+) (M2) MØ. This type of MØ favored the proliferation of smooth muscle cells, in vitro. Arg II(+) (M1) MØ appeared and prevailed in lesions of aged ApoE KO mice and lesion progression was correlated with the dominance of M1 over the M2 MØ phenotype. In order to address whether the M2->M1 switch could be due to a phenotypic switch of the infiltrated cells, we performed in vitro repolarization experiments. We found that fully polarized MØ retained their plasticity since they could revert their phenotype. The analysis of the distribution of Arg I- and Arg II-expressing MØ also argued against a recent recruitment of M1 MØ in the lesion. The combined data therefore suggest that the M2->M1 switch observed in vivo is due to a conversion of cells already present in the lesion. Our study suggests that interventional tools able to revert the MØ infiltrate towards the M2 phenotype may exert an atheroprotective action.
Conflict of interest statement
Figures
 and
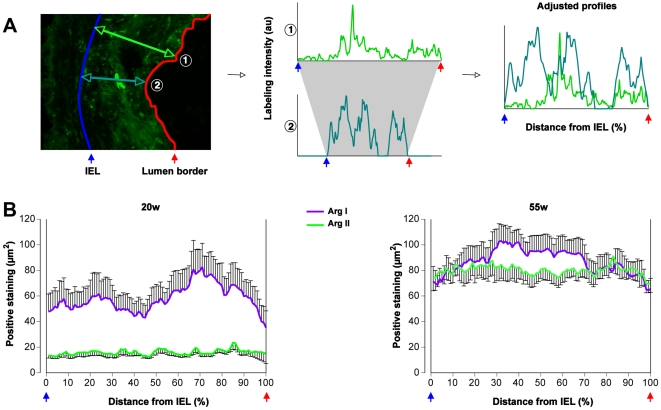
and  are plotted as representative examples. B: Adjusted profiles showing the Arg I and Arg II labeling distributions in the lesion in early (20w) and advanced (55w) aortic cusps of ApoE KO mice.
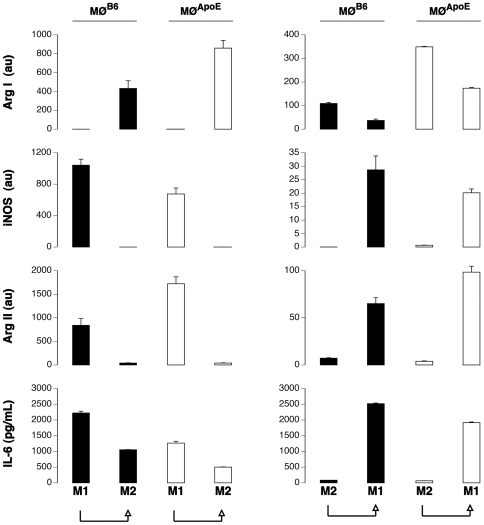
Similar articles
-
Relationship between CCL22 Expression by Vascular Smooth Muscle Cells and Macrophage Histamine Receptors in Atherosclerosis.J Atheroscler Thromb. 2018 Dec 1;25(12):1240-1254. doi: 10.5551/jat.44297. Epub 2018 May 22. J Atheroscler Thromb. 2018. PMID: 29794410 Free PMC article.
-
Pravastatin polarizes the phenotype of macrophages toward M2 and elevates serum cholesterol levels in apolipoprotein E knockout mice.J Int Med Res. 2018 Aug;46(8):3365-3373. doi: 10.1177/0300060518787671. Epub 2018 Jul 29. J Int Med Res. 2018. PMID: 30058421 Free PMC article.
-
Mediator 1 Is Atherosclerosis Protective by Regulating Macrophage Polarization.Arterioscler Thromb Vasc Biol. 2017 Aug;37(8):1470-1481. doi: 10.1161/ATVBAHA.117.309672. Epub 2017 Jun 22. Arterioscler Thromb Vasc Biol. 2017. PMID: 28642237 Free PMC article.
-
Irgm1 promotes M1 but not M2 macrophage polarization in atherosclerosis pathogenesis and development.Atherosclerosis. 2016 Aug;251:282-290. doi: 10.1016/j.atherosclerosis.2016.07.011. Epub 2016 Jul 10. Atherosclerosis. 2016. PMID: 27439214
-
Curcumin as a potential modulator of M1 and M2 macrophages: new insights in atherosclerosis therapy.Heart Fail Rev. 2019 May;24(3):399-409. doi: 10.1007/s10741-018-09764-z. Heart Fail Rev. 2019. PMID: 30673930 Review.
Cited by
-
Macrophage depletion impairs corneal wound healing after autologous transplantation in mice.PLoS One. 2013 Apr 16;8(4):e61799. doi: 10.1371/journal.pone.0061799. Print 2013. PLoS One. 2013. PMID: 23613940 Free PMC article.
-
Atypical chemokine receptor 1 deficiency reduces atherogenesis in ApoE-knockout mice.Cardiovasc Res. 2015 Jun 1;106(3):478-87. doi: 10.1093/cvr/cvv124. Epub 2015 Apr 8. Cardiovasc Res. 2015. PMID: 25858253 Free PMC article.
-
Myeloperoxidase-Oxidized LDLs Enhance an Anti-Inflammatory M2 and Antioxidant Phenotype in Murine Macrophages.Mediators Inflamm. 2016;2016:8249476. doi: 10.1155/2016/8249476. Epub 2016 Aug 30. Mediators Inflamm. 2016. PMID: 27656049 Free PMC article.
-
Effects of High Fat Feeding and Diabetes on Regression of Atherosclerosis Induced by Low-Density Lipoprotein Receptor Gene Therapy in LDL Receptor-Deficient Mice.PLoS One. 2015 Jun 5;10(6):e0128996. doi: 10.1371/journal.pone.0128996. eCollection 2015. PLoS One. 2015. PMID: 26046657 Free PMC article.
-
In vitro effects of azide-containing human CRP isoforms and oxLDL on U937-derived macrophage production of atherosclerosis-related cytokines.Exp Ther Med. 2020 Nov;20(5):57. doi: 10.3892/etm.2020.9185. Epub 2020 Sep 4. Exp Ther Med. 2020. PMID: 32952647 Free PMC article.
References
-
- Mantovani A, Sica A, Sozzani S, Allavena P, Vecchi A, et al. The chemokine system in diverse forms of macrophage activation and polarization. Trends Immunol. 2004;25:677–686. - PubMed
-
- Mantovani A, Sozzani S, Locati M, Allavena P, Sica A. Macrophage polarization: tumor-associated macrophages as a paradigm for polarized M2 mononuclear phagocytes. Trends Immunol. 2002;23:549–555. - PubMed
-
- Munder M, Eichmann K, Modolell M. Alternative metabolic states in murine macrophages reflected by the nitric oxide synthase/arginase balance: competitive regulation by CD4+ T cells correlates with Th1/Th2 phenotype. J Immunol. 1998;160:5347–5354. - PubMed
-
- Shearer JD, Richards JR, Mills CD, Caldwell MD. Differential regulation of macrophage arginine metabolism: a proposed role in wound healing. Am J Physiol. 1997;272:E181–190. - PubMed
Publication types
MeSH terms
Substances
LinkOut - more resources
Full Text Sources
Other Literature Sources
Medical
Research Materials
Miscellaneous
