

A Twin Study into the Genetic and Environmental Influences on Academic Performance in Science in nine-year-old Boys and Girls
- PMID: 20111670
- PMCID: PMC2811965
- DOI: 10.1080/09500690701324190
A Twin Study into the Genetic and Environmental Influences on Academic Performance in Science in nine-year-old Boys and Girls
Abstract
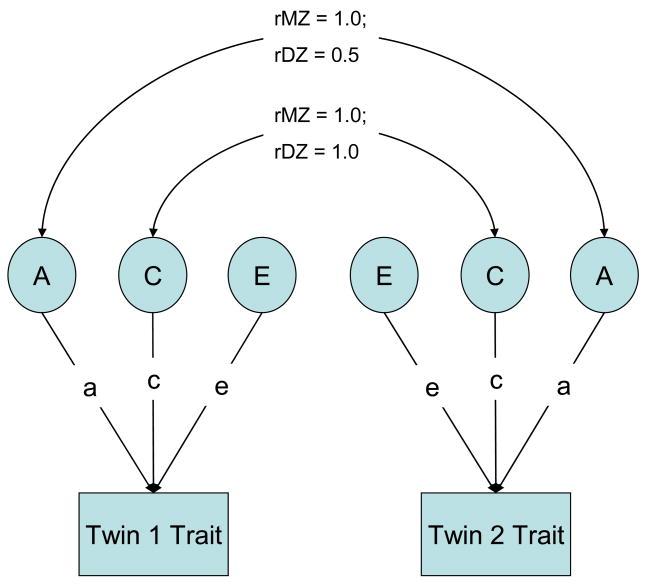
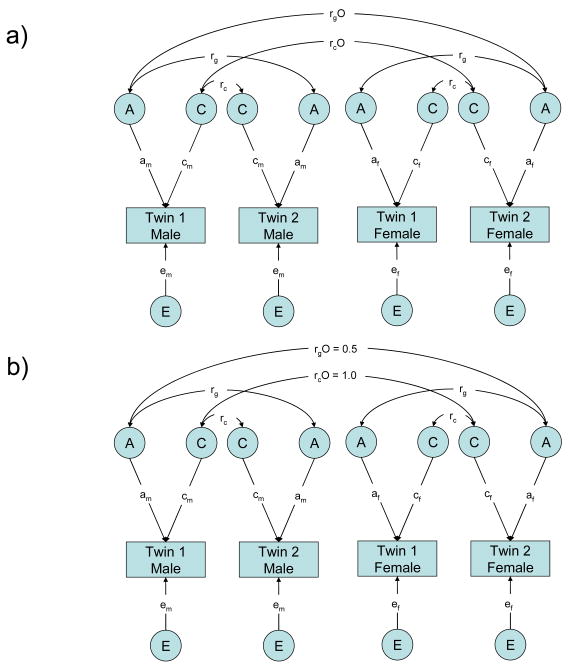
We investigated for the first time the genetic and environmental aetiology behind scientific achievement in primary school children, with a special focus on possible aetiological differences for boys and girls. For a representative community sample of 2,602 twin pairs assessed at age nine years, scientific achievement in school was rated by teachers based on National Curriculum criteria in three domains: Scientific Enquiry, Life Processes, and Physical Processes. Results indicate that genetic influences account for over 60% of the variance in scientific achievement, with environmental influences accounting for the remaining variance. Environmental influences were mainly of the non-shared variety, suggesting that children from the same family experience school environments differently. An analysis of sex differences considering differences in means, variances, and aetiology of individual differences found only differences in variance between the sexes, with boys showing greater variance in performance than girls.
Figures
Similar articles
-
The aetiology of educational attainment: A nuclear twin family study into the genetic and environmental influences on school leaving certificates.Br J Educ Psychol. 2022 Sep;92(3):881-897. doi: 10.1111/bjep.12478. Epub 2021 Dec 10. Br J Educ Psychol. 2022. PMID: 34889458
-
Self-control and grit are associated with school performance mainly because of shared genetic effects.JCPP Adv. 2023 Apr 26;3(2):e12159. doi: 10.1002/jcv2.12159. eCollection 2023 Jun. JCPP Adv. 2023. PMID: 37753153 Free PMC article.
-
Moderating Effects of Personality on the Genetic and Environmental Influences of School Grades Helps to Explain Sex Differences in Scholastic Achievement.Eur J Pers. 2008 May 1;22(3):247-268. doi: 10.1002/per.671. Eur J Pers. 2008. PMID: 20228967 Free PMC article.
-
Sex Differences in Genetic and Environmental Influences on Adolescent Depressive Symptoms: A Meta-Analytic Review.Depress Res Treat. 2015;2015:476238. doi: 10.1155/2015/476238. Epub 2015 Nov 15. Depress Res Treat. 2015. PMID: 26649194 Free PMC article. Review.
-
Folic acid supplementation and malaria susceptibility and severity among people taking antifolate antimalarial drugs in endemic areas.Cochrane Database Syst Rev. 2022 Feb 1;2(2022):CD014217. doi: 10.1002/14651858.CD014217. Cochrane Database Syst Rev. 2022. PMID: 36321557 Free PMC article.
Cited by
-
The Differential Heritability of Social Adjustment by Sex.Int J Environ Res Public Health. 2021 Jan 13;18(2):621. doi: 10.3390/ijerph18020621. Int J Environ Res Public Health. 2021. PMID: 33450905 Free PMC article.
-
The individual environment, not the family is the most important influence on preferences for common non-alcoholic beverages in adolescence.Sci Rep. 2017 Dec 4;7(1):16822. doi: 10.1038/s41598-017-17020-x. Sci Rep. 2017. PMID: 29203875 Free PMC article.
-
The etiology of science performance: decreasing heritability and increasing importance of the shared environment from 9 to 12 years of age.Child Dev. 2009 May-Jun;80(3):662-73. doi: 10.1111/j.1467-8624.2009.01289.x. Child Dev. 2009. PMID: 19489895 Free PMC article.
-
Shared genetic aetiology between cognitive performance and brain activations in language and math tasks.Sci Rep. 2018 Dec 4;8(1):17624. doi: 10.1038/s41598-018-35665-0. Sci Rep. 2018. PMID: 30514932 Free PMC article.
-
Maturational Changes of Delta Waves in Monozygotic and Dizygotic Infant Twins.J Exp Neurosci. 2018 Aug 27;12:1179069518797108. doi: 10.1177/1179069518797108. eCollection 2018. J Exp Neurosci. 2018. PMID: 30181687 Free PMC article.
References
-
- Akaike H. Factor analysis and AIC. Psychometrika. 1987;52:317–332.
-
- Alvidrez J, Weinstein RS. Early teacher perceptions and later student academic achievement. Journal of Educational Psychology. 1999;91:731–746.
-
- ASSET. The Athena survery of science engineering and technology in higher education. Norwich, UK: UEA; 2003. (Report No. 26)
-
- Bouchard TJ, Jr, Propping P. Twins as a tool of behavioral genetics. Chichester, UK: John Wiley & Sons; 1993.
-
- Cohen J. Statistical power analysis for the behavioral sciences. 2. Hillsdale, NJ: Lawrence Erlbaum Associates; 1988.
Grants and funding
LinkOut - more resources
Full Text Sources