Review
. 2009 Jul 28;10(8):3283-3315.
doi: 10.3390/ijms10083283.

Isothermal microcalorimetry to investigate non specific interactions in biophysical chemistry

Affiliations
Review

Isothermal microcalorimetry to investigate non specific interactions in biophysical chemistry

Vincent Ball et al. Int J Mol Sci. .

Abstract

Isothermal titration microcalorimetry (ITC) is mostly used to investigate the thermodynamics of "specific" host-guest interactions in biology as well as in supramolecular chemistry. The aim of this review is to demonstrate that ITC can also provide useful information about non-specific interactions, like electrostatic or hydrophobic interactions. More attention will be given in the use of ITC to investigate polyelectrolyte-polyelectrolyte (in particular DNA-polycation), polyelectrolyte-protein as well as protein-lipid interactions. We will emphasize that in most cases these "non specific" interactions, as their definition will indicate, are favoured or even driven by an increase in the entropy of the system. The origin of this entropy increase will be discussed for some particular systems. We will also show that in many cases entropy-enthalpy compensation phenomena occur.

Keywords: isothermal titration calorimetry; non-specific interactions.


Figures

Figure 1.
Figure 1.
Relationship between the logarithm of the binding constant and the reduction in surface area accessible to the solvent upon binding between two partner molecules. This plot is based on the data in Table 7 of Houk et al. [12].
  1. interactions between α-cyclodextrins and organic guests.

  2. interactions between catalytic antibodies and organic substrates.

  3. interactions between albumins and organic guests.

  4. interactions between catalytic antibodies and inhibitors.

  5. interactions between enzymes and inhibitors.

  6. interactions between antibodies and proteins.

The straight line is a linear regression to the data (r2=0.86) whereas the dashed line corresponds to the limit of the 95 % confidence interval.
Figure 2.
Figure 2.
Schematic representation of the difference in geometric disposition between three chemical groups able to interact with complementary receptor sites on a binding partner molecule allowing for only “non-specific” interactions (A) and “specific” interactions (B). Nevertheless “non-specific” interactions can also contribute to increase the binding affinity in the case of B because of desolvation of both molecules upon their contact. In the case of a given biomolecule one can go from situation B to A by a single conformational change.
Figure 3.
Figure 3.
Thermodynamic data describing the micellisation of sodium dodecyl sulfate as a function of the NaCl concentration and at 298 K. Data taken from Refs. [59] and [60]. ( formula image): ΔHmicellisation0, ( formula image): T.ΔSmicellisation0, (▪): ΔGmicellisation0 The dashed line corresponds to a process implying no change in energy.
Figure 4.
Figure 4.
Enthalpy-entropy compensation plots for the micellization of alkylpyridinium surfactants as a function of the used counteranion: ( formula image): I, the slope of the linear regression is α=0.98, ( formula image): Br, α=0.93, ( formula image): Cl, α=0.93. The ITC experiments were performed between 303 and 333 K. Data taken from Ref. [65].
Figure 5.
Figure 5.
Variation of the logarithm of the Trp-(Lys)n (2 ≤ n ≤ 8)-polyU binding constant as a function of the valence of the polypeptide. The slope of the straight line yields ψ=0.68, according to equation (17). Data from Table 1 of reference [109].
Figure 6.
Figure 6.
Variation of the binding enthalpy between BSA and PAH as a function of the ionic strength, as obtained from ITC [113].
Figure 7.
Figure 7.
Enthalpy-entropy compensation plot for the ITC data of Bloomfiled et al. [121] describing the two interaction regimes between Co(NH3)63+ and DNA. Enthalpy and entropy changes associated with: ( formula image) Co(NH3)63+-pUC118 binding and: (•) condensation of pUC118. The full and dashed lines correspond to the linear regression and the limit of the 95 % confidence interval respectively.
Figure 8.
Figure 8.
Thermodynamic data describing the interactions between (KIGAKI)3 peptides (in 5 mM cacodylate buffer at pH 7.5) and small unilamellar vesicles made of POPE/POPG/pegylated POPE (70/25/5 mol%). Part A: relation between the enthalpy change (recorded from an ITC titration) and the increase in the number of amino acids implied in β sheet structures (obtained from CD spectroscopy). The full line corresponds to a linear regression to the data (r2=0.89) whereas the dashed line corresponds to the limit of the 95 % confidence interval. Part B: Enthalpy-entropy compensation plot corresponding to the same peptide/vesicle system. The full line corresponds to a linear regression to the data (r2=0.83) whereas the dashed line corresponds to the limit of the 95% confidence interval. Data taken from Ref. [137].
Figure 9.
Figure 9.
DSC traces of large unilamellar vesicles made from a DPPC/DPPG/CL mixture (80/10/10 w/w) in the absence (A) and in the presence of adsorbed PLL (B). Modified from reference [144]. Cp is given in kCal.mol−1.K−1.
Figure 10.
Figure 10.
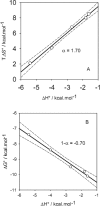
A: Enthalpy-entropy compensation plot for the adsorption of statherin onto hydroxyapatite particles (having a specific surface area of 53 m2.g−1) at different temperatures (between 15 and 37°C) in the presence of phosphate buffer. Data from Table 1 of reference [157]. The slope of the linear regression curve (r2=0.995) is α=1.70, calculated according to equation (14). B: correlation between the change in standard free energy upon adsorption with the enthalpy change. The slope of the linear regression curve (r2=0.989) is equal to −0.70 in full agreement with the α value obtained in part A and with equation (15), showing that there is a “true” enthalpy-entropy compensation. The dashed lines represent the limits of the 95 % confidence intervals.

Similar articles

Cited by

References

    1. Ruben AJ, Kiso Y, Freire E. Overcomming roadblocks in lead optimization:a thermodynamic perspective. Chem. Biol. Drug Des. 2006;67:2–4. - PubMed
    1. Cantor CR, Shimmel PR.Biophysical Chemistry. Part III. The behavior of biological macromolecules W.H. Freeman and Company; New York, NY, USA: 1980. Chapter 15.
    1. Rose T.di Cera E.Thermodynamic dissection of cooperativity in ligand recognition Thermodynamics in Biology Oxford University Press; New York, NY, USA: 2000. Chapter 2.
    1. Lehn JM. Supramolecumar Chemistry. Wiley-VCH. Weinheim; Berlin, Germany: 1995.
    1. Alberts B, Bray D, Lewis J, Kaff M, Roberts K, Watson JD. Molecular Biology of the Cell. 3rd Ed. Garland Publishing Inc; New York, NY, USA: 1993.

LinkOut - more resources