

Human ovarian reserve from conception to the menopause
- PMID: 20111701
- PMCID: PMC2811725
- DOI: 10.1371/journal.pone.0008772
Human ovarian reserve from conception to the menopause
Abstract
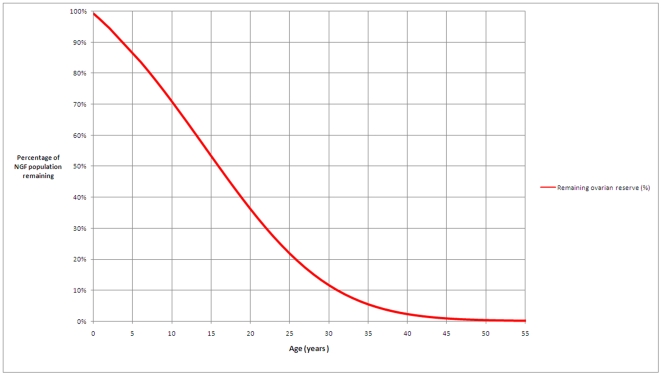
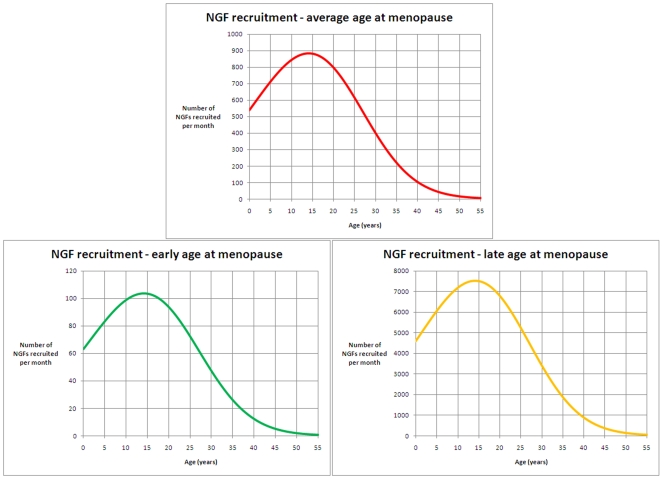
The human ovary contains a fixed number of non-growing follicles (NGFs) established before birth that decline with increasing age culminating in the menopause at 50-51 years. The objective of this study is to model the age-related population of NGFs in the human ovary from conception to menopause. Data were taken from eight separate quantitative histological studies (n = 325) in which NGF populations at known ages from seven weeks post conception to 51 years (median 32 years) were calculated. The data set was fitted to 20 peak function models, with the results ranked by obtained r2 correlation coefficient. The highest ranked model was chosen. Our model matches the log-adjusted NGF population from conception to menopause to a five-parameter asymmetric double Gaussian cumulative (ADC) curve (r2 = 0.81). When restricted to ages up to 25 years, the ADC curve has r2 = 0.95. We estimate that for 95% of women by the age of 30 years only 12% of their maximum pre-birth NGF population is present and by the age of 40 years only 3% remains. Furthermore, we found that the rate of NGF recruitment towards maturation for most women increases from birth until approximately age 14 years then decreases towards the menopause. To our knowledge, this is the first model of ovarian reserve from conception to menopause. This model allows us to estimate the number of NGFs present in the ovary at any given age, suggests that 81% of the variance in NGF populations is due to age alone, and shows for the first time, to our knowledge, that the rate of NGF recruitment increases from birth to age 14 years then declines with age until menopause. An increased understanding of the dynamics of human ovarian reserve will provide a more scientific basis for fertility counselling for both healthy women and those who have survived gonadotoxic cancer treatments.
Conflict of interest statement
Figures
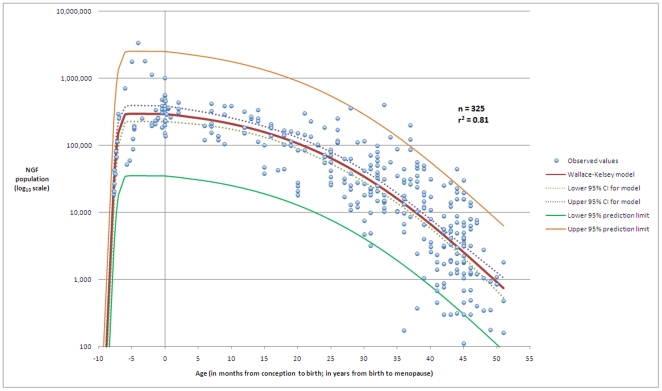
 = 5.56 (95% CI 5.38–5.74),
  = 25.6 (95% CI 24.9–26.4),
  = 52.7 (95% CI 51.1–54.2),
  = 0.074 (95% CI 0.062–0.085), and
  = 24.5 (95% CI 20.4–28.6). Our model has correlation coefficient
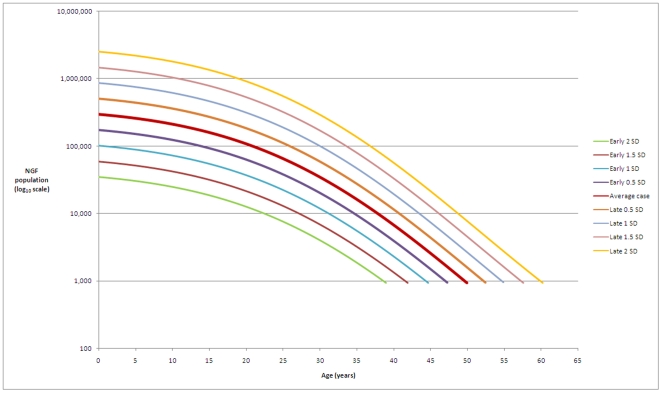
  = 0.81, fit standard error = 0.46 and F-value = 364. The figure shows the dataset (n = 325), the model, the 95% prediction limits of the model, and the 95% confidence interval for the model. The horizontal axis denotes age in months up to birth at age zero, and age in years from birth to 51 years.
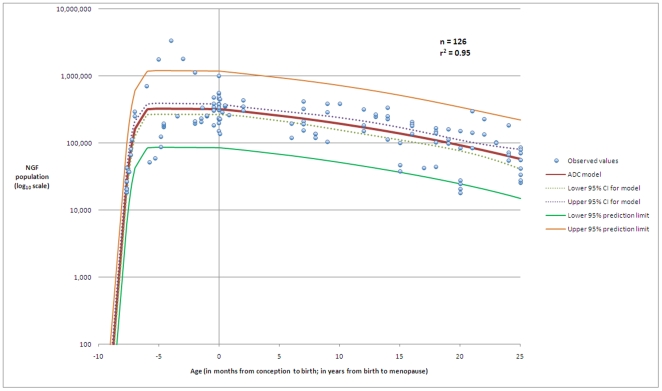
 = 5.79 (95% CI 5.03–6.55),
  = 28.0 (95% CI 15.8–40.2),
  = 57.4 (95% CI 33.1–81.8),
  = 0.074 (95% CI 0.067–0.081), and
  = 34.3 (95% CI −4.2–72.8). This model has correlation coefficient
  = 0.95, fit standard error = 0.29 and F-value = 585. This figure shows the dataset (n = 126), the model, the 95% prediction limits of the model, and the 95% confidence interval for the model. The horizontal axis denotes age in months up to birth at age zero, and age in years from birth to 25 years.
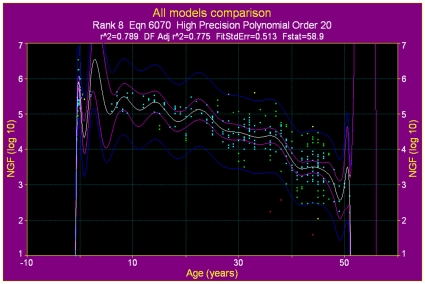
 . Compared to the ADC model for the same data, the model has lower correlation coefficient, higher fit standard error, and lower F-statistic. All other TableCurve models that allow multiple peaks have an inferior fit to the data.
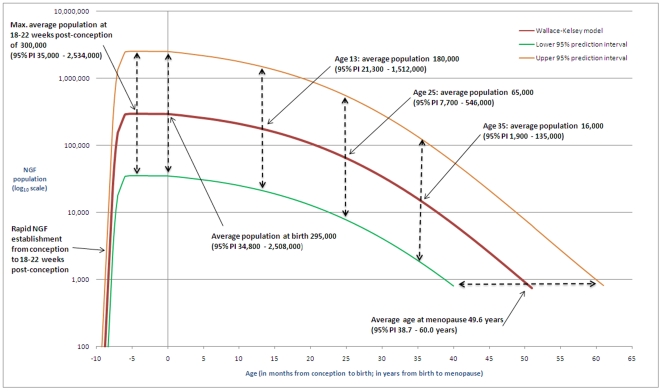
References
-
- Faddy MJ, Gosden RG, Gougeon A, Richardson SJ, Nelson JF. Accelerated disappearance of ovarian follicles in mid-life: implications for forecasting menopause. Human Reproduction. 1992;7:1342–1346. - PubMed
-
- Faddy MJ, Gosden RG. A model conforming the decline in follicle numbers to the age of menopause in women. Human Reproduction. 1996;11:1484–1486. - PubMed
-
- Johnson J, Canning J, Kaneko T, Pru JK, Tilly JL. Germline stem cells and follicular renewal in the postnatal mammalian ovary. Nature. 2004;428:145–150. - PubMed
-
- Zou K, Yuan Z, Yang Z, Luo H, Sun K, et al. Production of offspring from a germline stem cell line derived from neonatal ovaries. Nature Cell Biology. 2009;11:631–636. - PubMed
Publication types
MeSH terms
LinkOut - more resources
Full Text Sources
Other Literature Sources
Medical
