

Ecoregion prioritization suggests an armoury not a silver bullet for conservation planning
- PMID: 20111722
- PMCID: PMC2811746
- DOI: 10.1371/journal.pone.0008923
Ecoregion prioritization suggests an armoury not a silver bullet for conservation planning
Abstract
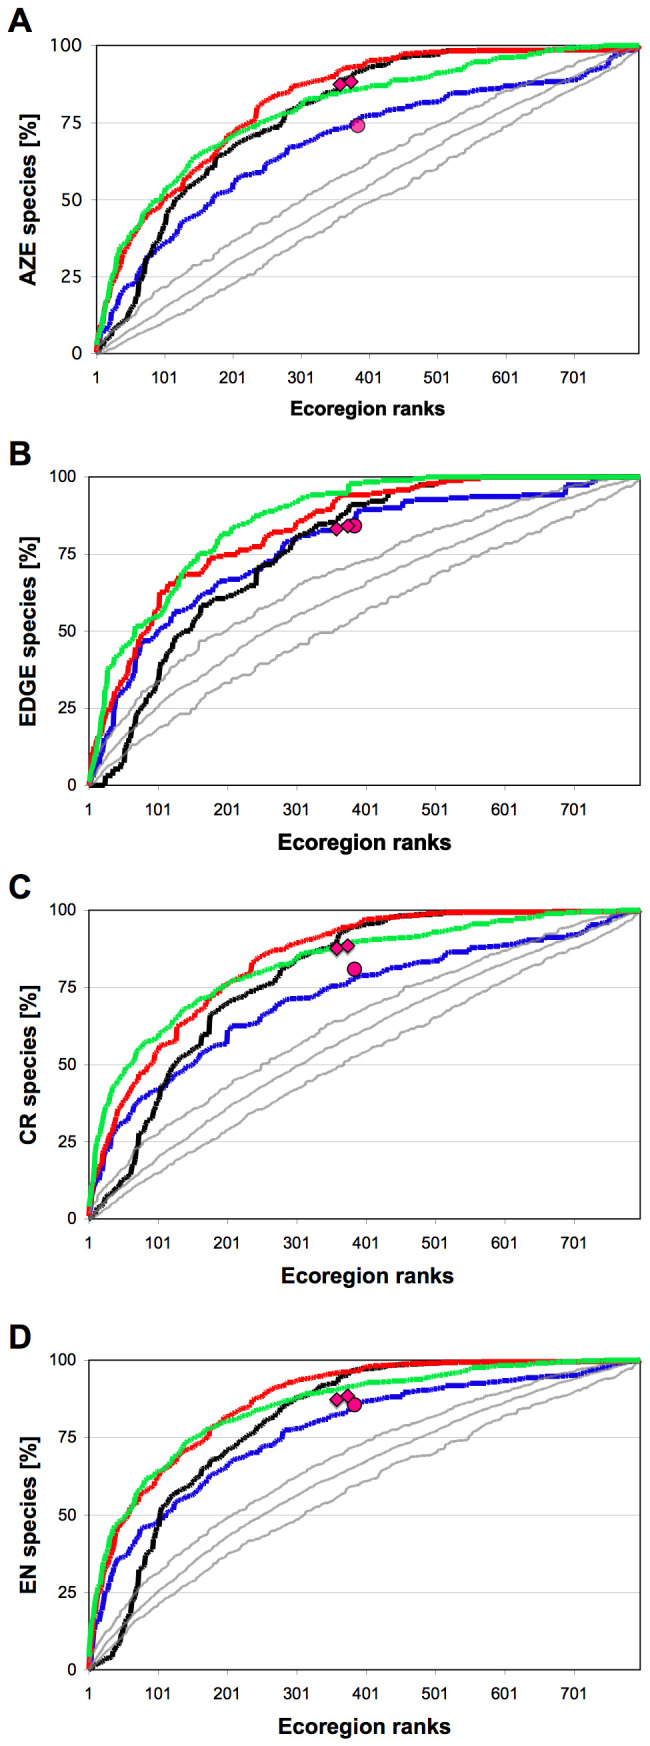
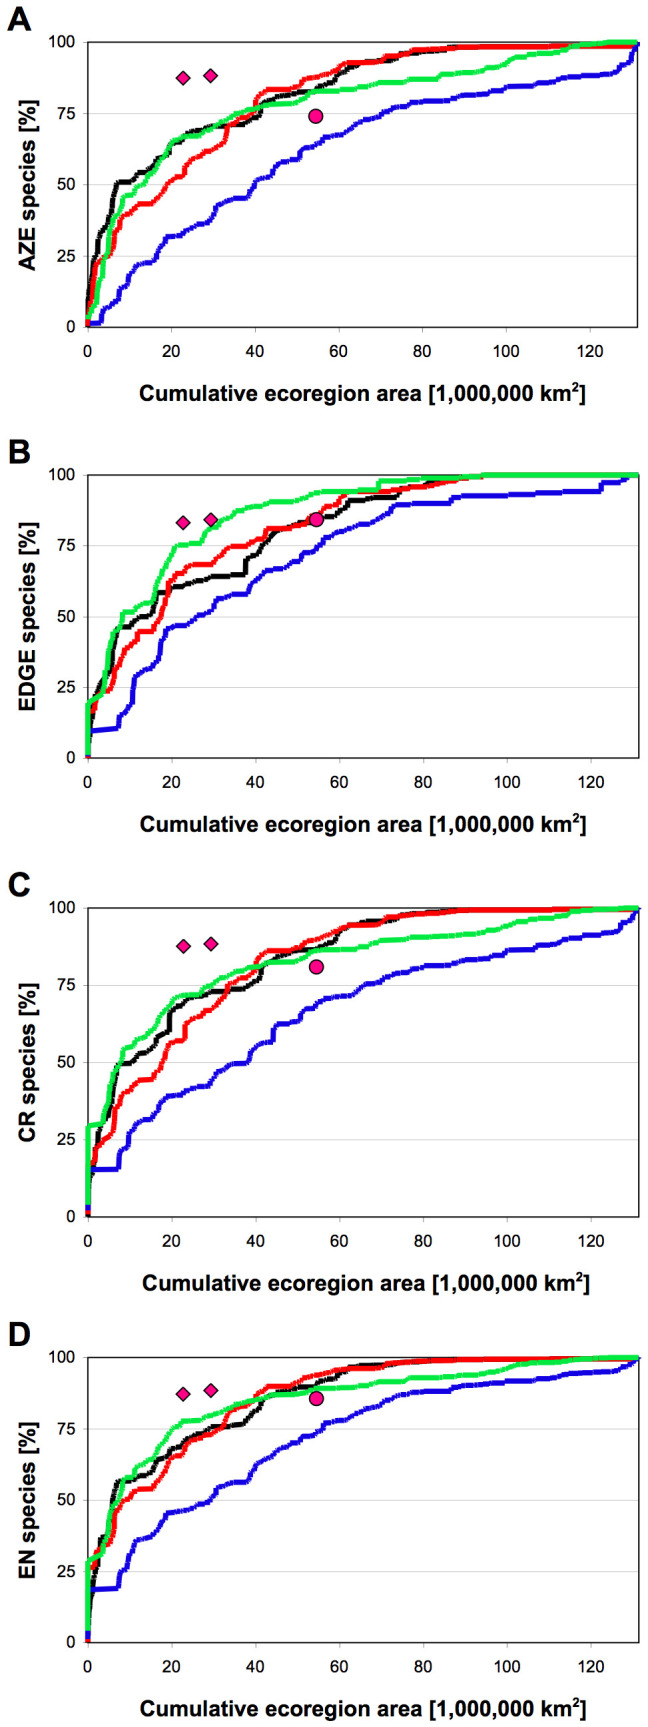
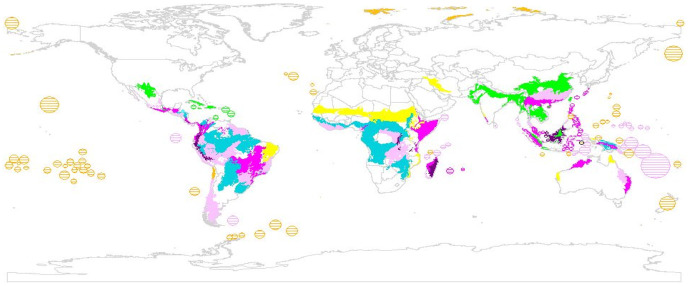
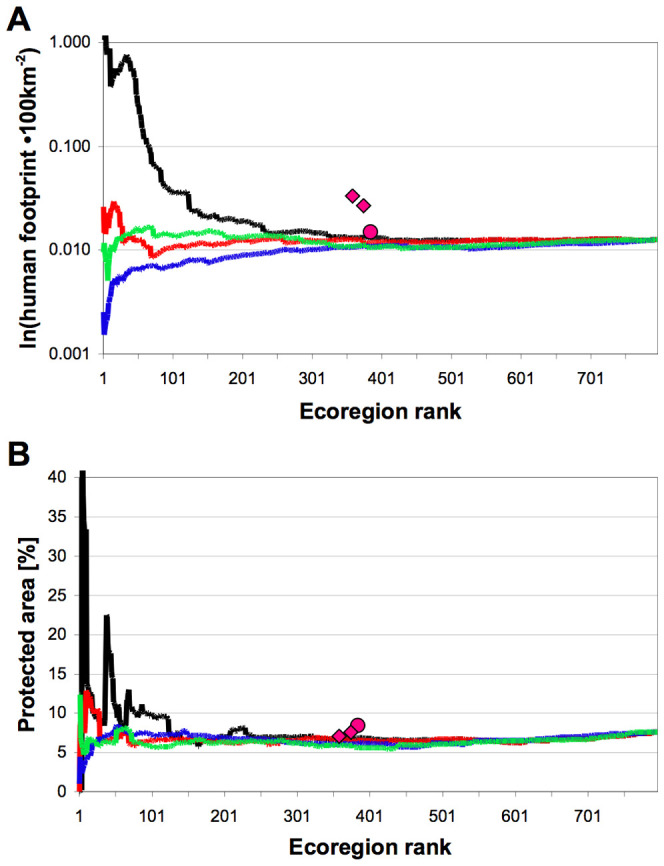
In the face of accelerating species extinctions, map-based prioritization systems are increasingly useful to decide where to pursue conservation action most effectively. However, a number of seemingly inconsistent schemes have emerged, mostly focussing on endemism. Here we use global vertebrate distributions in terrestrial ecoregions to evaluate how continuous and categorical ranking schemes target and accumulate endangered taxa within the IUCN Red List, Alliance for Zero Extinction (AZE), and EDGE of Existence programme. We employed total, endemic and threatened species richness and an estimator for richness-adjusted endemism as metrics in continuous prioritization, and WWF's Global200 and Conservation International's (CI) Hotspots in categorical prioritization. Our results demonstrate that all metrics target endangerment more efficiently than by chance, but each selects unique sets of top-ranking ecoregions, which overlap only partially, and include different sets of threatened species. Using the top 100 ecoregions as defined by continuous prioritization metrics, we develop an inclusive map for global vertebrate conservation that incorporates important areas for endemism, richness, and threat. Finally, we assess human footprint and protection levels within these areas to reveal that endemism sites are more impacted but have more protection, in contrast to high richness and threat ones. Given such contrasts, major efforts to protect global biodiversity must involve complementary conservation approaches in areas of unique species as well as those with highest diversity and threat.
Conflict of interest statement
Figures
References
-
- Pearce D. Do we really care about Biodiversity? Environmental and Resource Economics. 2007;37(1):313–333.
-
- Margules CR, Pressey RL, Williams PH. Representing biodiversity: data and procedures for identifying priority areas for conservation. Journal of Biosciences. 2002;27(4):309–326. - PubMed
-
- McBride MF, Wilson KA, Bode M, Possingham HP. Incorporating the effects of socioeconomic uncertainty into priority setting for conservation investment. Conservation Biology. 2007;21(6):1463–1474. - PubMed
-
- Hoekstra JM, Boucher TM, Ricketts TH, Roberts C. Confronting a biome crisis: global disparities of habitat loss and protection. Ecology Letters. 2005;8:23–29.
Publication types
MeSH terms
LinkOut - more resources
Full Text Sources
