. 2010:2010:202397.
doi: 10.1155/2010/202397. Epub 2010 Jan 13.

Activation-induced T helper cell death contributes to Th1/Th2 polarization following murine Schistosoma japonicum infection

Affiliations

Activation-induced T helper cell death contributes to Th1/Th2 polarization following murine Schistosoma japonicum infection

Xinyu Xu et al. J Biomed Biotechnol. 2010.

Abstract

In chronic infectious diseases, such as schistosomiasis, pathogen growth and immunopathology are affected by the induction of a proper balanced Th1/Th2 response to the pathogen and by antigen-triggered activation-induced T cell death. Here, by using S. japonicum infection or schistosome antigens-immunized mouse model, or antigens in vitro stimulation, we report that during the early stage of S. japonicum infection, nonegg antigens trigger Th2 cell apoptosis via the granzyme B signal pathway, contributing to Th1 polarization, which is thought to be associated with worm clearance and severe schistosomiasis. Meanwhile, after the adult worms lay their eggs, the egg antigens trigger Th1 cell apoptosis via the caspase pathway, contributing to Th2 polarization, which is associated with mild pathology and enhanced survival of both worms and their hosts. Thus, our study suggests that S. japonicum antigen-induced Th1 and Th2 cell apoptosis involves the Th1/Th2 shift and favorites both hosts and parasites.


Figures
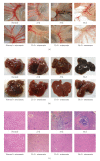
Figure 1
Figure 1
Parasitological and histopathological examination of infected mice treated with or without artesunate. In each experiment, twelve mice were percutaneously infected with S. japonicum and among these mice, six were orally administered artesunate dissolved in ddH2O as described in Materials and Methods. At 23, 35, and 56 days mice were sacrificed and perfused to measure the worm and liver egg burdens and for histopathological analysis. (a) Adult worms in the mesenteric veins of infected mice. (b) Egg nodes in the surface of the livers. (c) Microscopic examination of hepatic granulomatous inflammation in liver sections (Magnification: ×400). Measurements were made at 0 d and at three time points postinfection. Each micrograph is representative of three experiments.
Figure 2
Figure 2
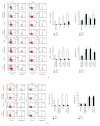
Kinetic analysis of Th1/Th2 cell polarization and apoptosis in mice infected with S. japonicum. In each experiment, twelve mice were percutaneously infected with S. japonicum and among these mice, six were orally administered artesunate dissolved in ddH2O as described in Materials and Methods. At 23, 35, and 56 days mice were sacrificed and single cell suspension of splenocytes were prepared. (a) CD4+ T cells were purified from splenocytes using MACS, surface stained with anti-CD4-FITC and then intracellularly stained with rabbit antimouse caspase-3 antibody or rabbit IgG isotype control antibody plus anti-IFN-γ-PE, anti-IL-4-PE, or isotype IgG control mAbs for FACS analysis. The splenocytes were restimulated in vitro with SWA (b) or SEA (c) for 36 hours, and then the CD4+ T cells were purified by MACS and stained with above antibodies prior to FACS analysis. The percentage of apoptotic cells in the FACS data was derived from the CD4+ and IFN-γ+, or CD4+ and IL-  4+ cells and gated on the caspase-3+ population. Data are expressed as the mean ± SD of 18 mice from three independent experiments. *P < .05; **P < .01. Left panels: One representative experiment of flow cytometric analysis with the average percentage of Th or apoptotic cells shown in the FACS data. Right panels: The statistical analysis of 18 mice from three independent experiments.
Figure 2
Figure 2
Kinetic analysis of Th1/Th2 cell polarization and apoptosis in mice infected with S. japonicum. In each experiment, twelve mice were percutaneously infected with S. japonicum and among these mice, six were orally administered artesunate dissolved in ddH2O as described in Materials and Methods. At 23, 35, and 56 days mice were sacrificed and single cell suspension of splenocytes were prepared. (a) CD4+ T cells were purified from splenocytes using MACS, surface stained with anti-CD4-FITC and then intracellularly stained with rabbit antimouse caspase-3 antibody or rabbit IgG isotype control antibody plus anti-IFN-γ-PE, anti-IL-4-PE, or isotype IgG control mAbs for FACS analysis. The splenocytes were restimulated in vitro with SWA (b) or SEA (c) for 36 hours, and then the CD4+ T cells were purified by MACS and stained with above antibodies prior to FACS analysis. The percentage of apoptotic cells in the FACS data was derived from the CD4+ and IFN-γ+, or CD4+ and IL-  4+ cells and gated on the caspase-3+ population. Data are expressed as the mean ± SD of 18 mice from three independent experiments. *P < .05; **P < .01. Left panels: One representative experiment of flow cytometric analysis with the average percentage of Th or apoptotic cells shown in the FACS data. Right panels: The statistical analysis of 18 mice from three independent experiments.
Figure 3
Figure 3
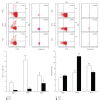
Polarization and apoptosis of Th1/Th2 cells in SWA/SEA immunized mice. Mice were injected subcutaneously in the back with 100 μl of a solution containing 50 μg of SEA, 100 μg of SWA, or PBS alone emulsified in incomplete Freund's adjuvant (IFA). Ten days after immunization, six mice from each group were sacrificed. Splenocytes from SWA or SEA immunized mice were prepared, respectively, and then CD4+ T cells were purified from splenocytes with MACS. The cells were stained with anticaspase-3, anti-CD4-FITC, anti-IFN-γ-PE or anti-IL-4-PE mAb prior to FACS analysis as described in Materials and Methods. The percentage of apoptotic cells in the FACS data was derived from the number of cells that were CD4+ and IFN-γ+ or CD4+ and IL-4+ and gated on the caspase-3+ population. Data are expressed as the mean ± SD of 18 mice from three independent experiments. *P < .05; **P < .01. Upper panels: One representative experiment of flow cytometric analysis with the average percentage of Th or apoptotic cells shown in the FACS data. Lower panels: The statistical analysis of 18 mice from three independent experiments.
Figure 4
Figure 4
In vitro induction of polarization and apoptosis in CD4+ T cells derived from normal mice with SWA and SEA. CD4+ T cells were purified from normal mice by MACS and preactivated overnight with anti-CD3 (2 μg/mL) and anti-CD28 (1 μg/mL) antibodies. Then the cells were stimulated with specific antigens of SEA, SWA or PBS alone for 36 hours at 37°C in 5% CO2, followed by staining with rabbit antimouse caspase-3 antibody or rabbit IgG isotype control antibody plus anti-CD4-FITC, anti-IFN-γ-PE anti-IL-4-PE mAbs, or isotype control antibodies prior to FACS analysis. The percentage of apoptotic cells in the FACS data was derived from the number of cells that were CD4+ and IFN-γ+ or CD4+ and IL-4+ and gated on the caspase-3+ population. Data are expressed as the mean ± SD of 18 mice from three independent experiments. *P < .05; **P < .01. Upper panels: One representative experiment of flow cytometric analysis with the average percentage of Th or apoptotic cells shown in the FACS data. Lower panels: The statistical analysis of 18 mice from three independent experiments.
Figure 5
Figure 5
Caspase and GrB may be involved in different types of Th cell apoptotic mechanisms that are induced by different S. japonicum antigens. (a) Splenocytes from SWA-immunized mice were restimulated in vitro with SWA or PBS in the presence or absence of the GrB inhibitor Z-AAD-CMK. (b) Splenocytes from SEA immunized mice were restimulated in vitro with SEA or PBS in the presence or absence of the caspase inhibitor Z-VAD-FMK. After 36 hours, restimulated CD4+ T cells in (a) and (b) were purified by MACS and stained with anti-IFN-γ-PE or anti-IL-4-PE mAbs. Apoptotic cells were labeled with an Apo-Direct TUNEL assay kit and then detected by FACS. The percentage of apoptotic Th1 or Th2 cells among the purified CD4+ T cells was derived from the number of IFN-γ+ or IL-4+ cells and gated on the TUNEL positive population. Data are expressed as the mean ± SD of 18 mice from three independent experiments. *P < .05; **P < .01. Left panels: One representative experiment of flow cytometric analysis with the average percentage of Th or apoptotic cells shown in the FACS data. Right panels: The statistical analysis of 18 mice from three independent experiments.

Similar articles

Cited by

References

    1. Infante-Duarte C. Th1/Th2 balance in infection. Springer Seminars in Immunopathology. 1999;21(3):317–338. - PubMed
    1. Anthony RM, Rutitzky LI, Urban JF, Stadecker MJ, Gause WC. Protective immune mechanisms in helminth infection. Nature Reviews Immunology. 2007;7(12):975–987. - PMC - PubMed
    1. MacDonald AS, Araujo MI, Pearce EJ. Immunology of parasitic helminth infections. Infection and Immunity. 2002;70(2):427–433. - PMC - PubMed
    1. Rogers PR, Croft M. Peptide dose, affinity, and time of differentiation can contribute to the Th1/Th2 cytokine balance. Journal of Immunology. 1999;163(3):1205–1213. - PubMed
    1. Balkhi MY, Latchumanan VK, Singh B, Sharma P, Natarajan K. Cross-regulation of CD86 by CD80 differentially regulates T helper responses from Mycobacterium tuberculosis secretory antigen-activated dendritic cell subsets. Journal of Leukocyte Biology. 2004;75(5):874–883. - PubMed

Publication types

MeSH terms

LinkOut - more resources