. 2010:2010:505694.
doi: 10.1155/2010/505694. Epub 2010 Jan 11.

The unexpected role for the aryl hydrocarbon receptor on susceptibility to experimental toxoplasmosis

Affiliations

The unexpected role for the aryl hydrocarbon receptor on susceptibility to experimental toxoplasmosis

Yuriko Sanchez et al. J Biomed Biotechnol. 2010.

Abstract

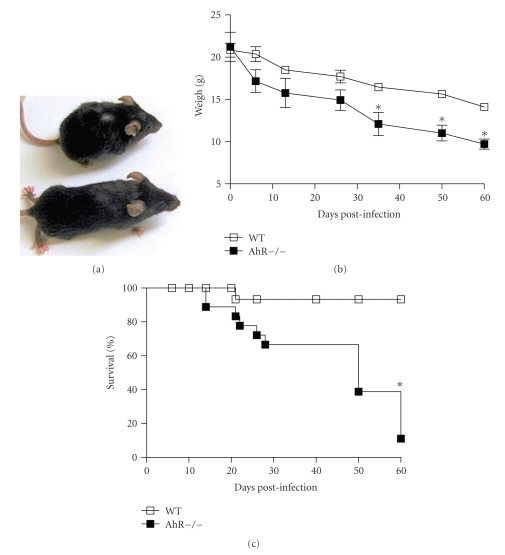
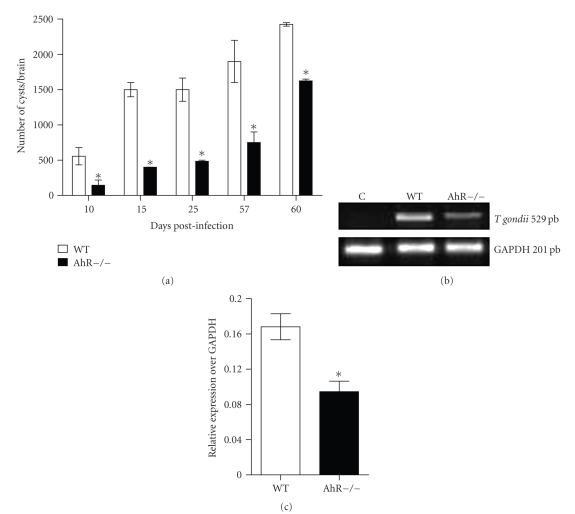
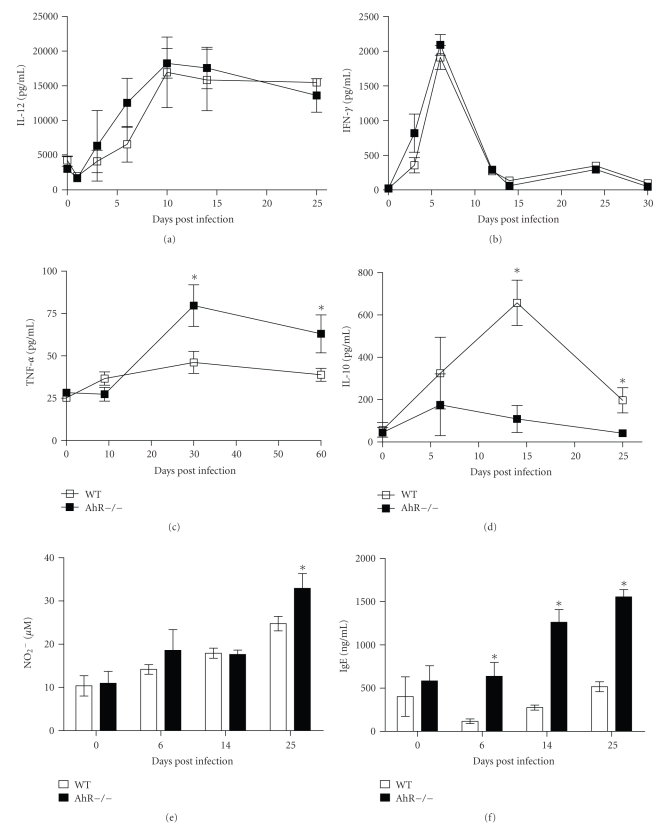
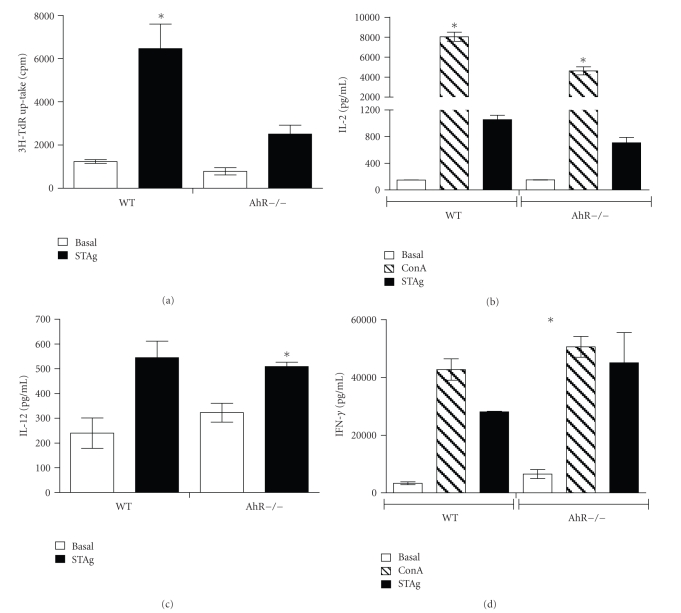
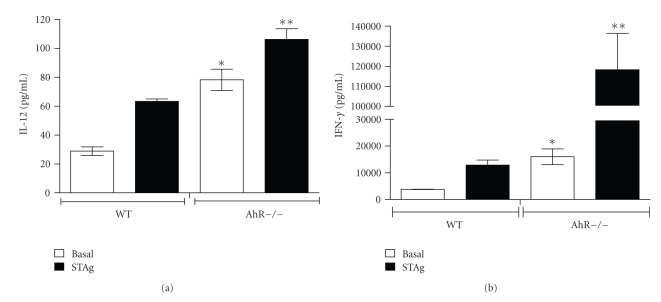
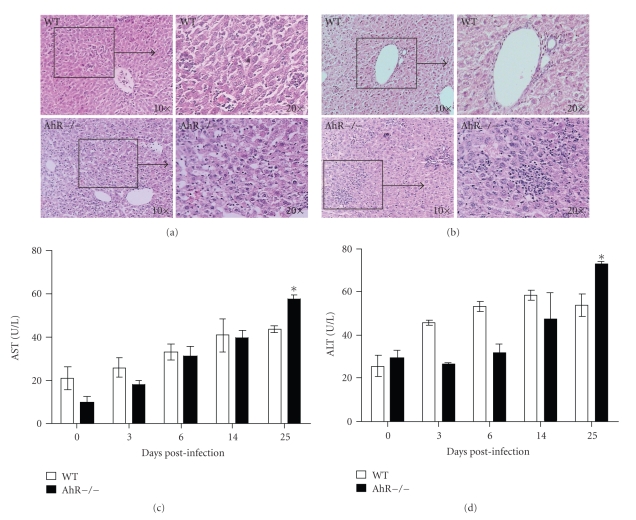
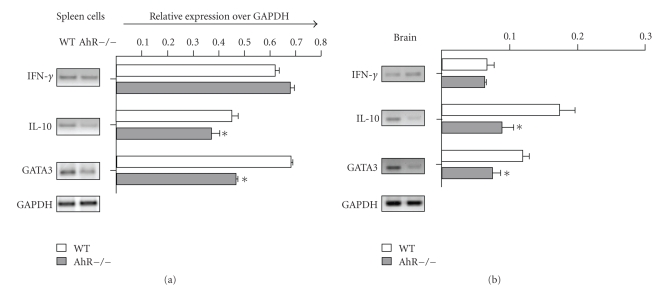
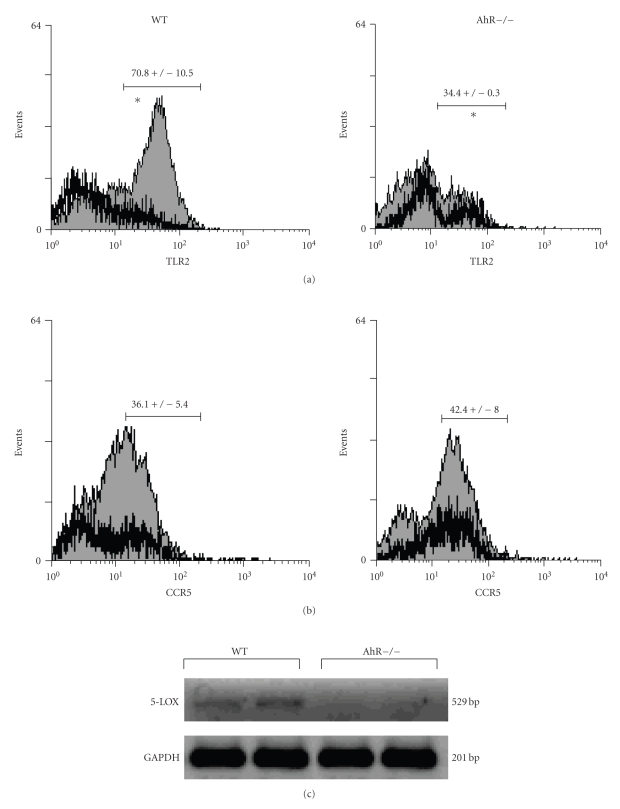
The aryl hydrocarbon receptor (AhR) is part of a signaling system that is mainly triggered by xenobiotic agents. Increasing evidence suggests that AhR may regulate immunity to infections. To determine the role of AhR in the outcome of toxoplasmosis, we used AhR-/- and wild-type (WT) mice. Following an intraperitoneal infection with Toxoplasma gondii (T. gondii), AhR-/- mice succumbed significantly faster than WT mice and displayed greater liver damage as well as higher serum levels of tumor necrosis factor (TNF)-alpha, nitric oxide (NO), and IgE but lower IL-10 secretion. Interestingly, lower numbers of cysts were found in their brains. Increased mortality was associated with reduced expression of GATA-3, IL-10, and 5-LOX mRNA in spleen cells but higher expression of IFN-gamma mRNA. Additionally, peritoneal exudate cells from AhR-/- mice produced higher levels of IL-12 and IFN-gamma but lower TLR2 expression than WT mice. These findings suggest a role for AhR in limiting the inflammatory response during toxoplasmosis.


Figures

Figure 1
Figure 1
AhR−/− mice infected with T. gondii display profound weight loss and accelerated mortality compared to infected-wild type mice. Physical appearance (a), body weight (b), and survival rate (c) of AhR−/− and WT mice infected with 40 cysts of T. gondii were monitored during the times indicated. The values presented are the mean ± SD of at least 6 animals per time point per group. The experiment shown is representative of at least four performed that gave similar results. *P < .05 for body weight by student's t-test; *  P < .0001 for survival rate by log-rank test between the means of the values obtained with AhR−/− versus wild-type control mice.
Figure 2
Figure 2
Parasite burden in T. gondii-infected AhR−/− and WT mice after i.p. injection with ME49 strain of T. gondii. (a) Number of cysts per brain obtained after a kinetics of days p.i. as counted under the microscope (40X magnification). Data are representatives of three independent experiments where n = five mice per group (*P < .01 with respect to WT, student's t-test). (b) T. gondii gene expression by semiquantitative PCR was performed in brains of noninfected mice (letter C) and WT and AhR−/− mice at 25 days post T. gondii infection using primers specific for the sequence of the T. gondii gene: A representative gel electrophoresis from three independent experiments. (c) PCR analysis for detection of T. gondii in brains of WT and AhR−/− mice at 25 days post T gondii infection (Student's t-test).
Figure 3
Figure 3
Levels of IL-12p70 (a), IFN-γ (b), TNF-α (c), IL-10 (d) nitric oxide (e), and total IgE (f) in sera from AhR−/− and WT mice infected with 40 cysts of T. gondii. For systemic cytokine, nitric oxide, and IgE production, mice were bled at the indicated time points and the levels of cytokines and total IgE (f) were measured in serum by ELISA and nitric oxide (e) was measured in serum by Griess assay as described above. The values presented are the mean ± SD of triplicate samples of 6 animals per time point per group. *P < .05 with respect to WT, Student's t-test.
Figure 4
Figure 4
STAg-induced proliferative responses of spleen cells. Isolated spleen cells from T. gondii-infected (25 days p.i.) WT or AhR−/− mice were stimulated with 2.5 μg/mL of STAg for 5 days in vitro. 3[H]TdrU was added (0.5 μCi/well) 20 hours before harvesting, and counts per minute (cpm) were calculated using a liquid scintillation counter (a). Secretion of IL-2 (b), IL-12 (c), and IFN-γ (d) in supernatants recovered from cell cultures were evaluated by an ELISA-sandwich. Means ± SE, n = 5.*P < .05, Student's t-test.
Figure 5
Figure 5
IL-12 and IFN-γ levels of PECs from T. gondii-infected AhR−/− and WT mice. After 25 days of T. gondii infection, PECs from AhR−/− or WT mice were recovered and restimulated in vitro with 2.5 μg/mL of STAg for 24 hours. The IL-12 and IFN-γ levels were determined by ELISA-sandwich on supernatants recovered from cultures. Means ± SE, n = 5.*P < .05 with respect to basal bars values. **P < .05 with respect to STAg stimulus, Student's t-test.
Figure 6
Figure 6
Representative histopathological liver changes after 10 days (a) or 25 days (b) of infection with 40 cysts of T. gondii. Note the mass of necrosis observed by H & E staining (arrow). (c) Serum transaminase levels on AhR−/− and WT infected mice. *P < .05, Student's t-test.
Figure 7
Figure 7
Gel electrophoresis on IFN-γ, IL-10, GATA-3, and GAPDH-amplified products. Total RNA was isolated from Splenocytes (a) or brain tissue (b) from WT and AhR−/− mice at 25 days after T gondii infection as described in Materials and Methods. The resulting fragments migrated along with the 200–500 bp fragment of the 100 kb marker used. The exact fragment sizes are listed in Table 1.
Figure 8
Figure 8
Flow cytometric profiles of adherent exudate macrophages stained for TLR2 and CCR5. The histograms represent TLR2 (a) or CCR5 (b) versus F4/80 expression on adherent macrophages from AhR−/− or WT mice challenged with STAg for 24 hours after 25 days of T. gondii infection: Nonstimulus (dark line) and STAg stimulus (gray curve). Shown are representative data from three to four independent experiments. Significances were calculated by Student's t test. *P < .05 WT versus AhR−/−. Gel electrophoresis of 5-LOX and GAPDH-amplified products (c). Total RNA was isolated from splenocytes from WT and AhR−/− mice at 25 days after T. gondii infection as described in Materials and Methods.

Similar articles

Cited by

References

    1. Whitlock JP., Jr. Induction of cytochrome P4501A1. Annual Review of Pharmacology and Toxicology. 1999;39:103–125. - PubMed
    1. Denison MS, Nagy SR. Activation of the aryl hydrocarbon receptor by structurally diverse exogenous and endogenous chemicals. Annual Review of Pharmacology and Toxicology. 2003;43:309–334. - PubMed
    1. Lai Z-W, Hundeiker C, Gleichmann E, Esser C. Cytokine gene expression during ontogeny in murine thymus on activation of the aryl hydrocarbon receptor by 2,3,7,8-tetrachlorodibenzo-p-dioxin. Molecular Pharmacology. 1997;52(1):30–37. - PubMed
    1. Jensen BA, Leeman RJ, Schlezinger JJ, Sherr DH. Aryl hydrocarbon receptor (AhR) agonists suppress interleukin-6 expression by bone marrow stromal cells: an immunotoxicology study. Environmental Health. 2003;2, article 1:1–13. - PMC - PubMed
    1. N'Diaye M, Le Ferrec E, Lagadic-Gossmann D, et al. Aryl hydrocarbon receptor- and calcium-dependent induction of the chemokine CCL1 by the environmental contaminant benzo[a]pyrene. Journal of Biological Chemistry. 2006;281(29):19906–19915. - PubMed

Publication types

MeSH terms

LinkOut - more resources