

Deletion of the Chd6 exon 12 affects motor coordination
- PMID: 20111866
- PMCID: PMC2844962
- DOI: 10.1007/s00335-010-9248-8
Deletion of the Chd6 exon 12 affects motor coordination
Abstract
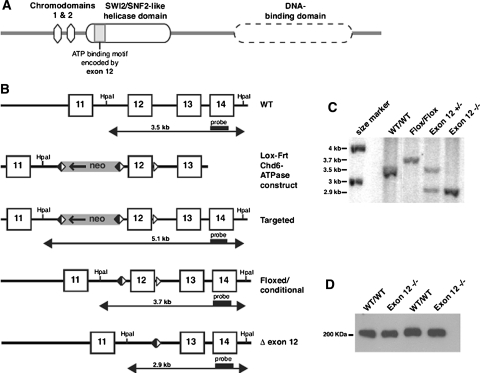
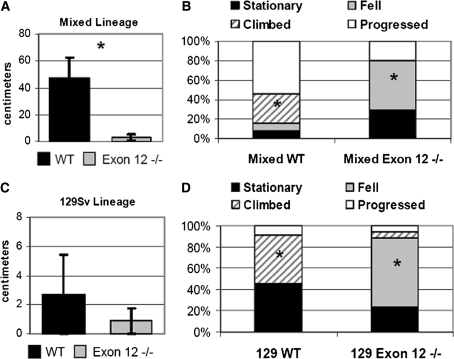
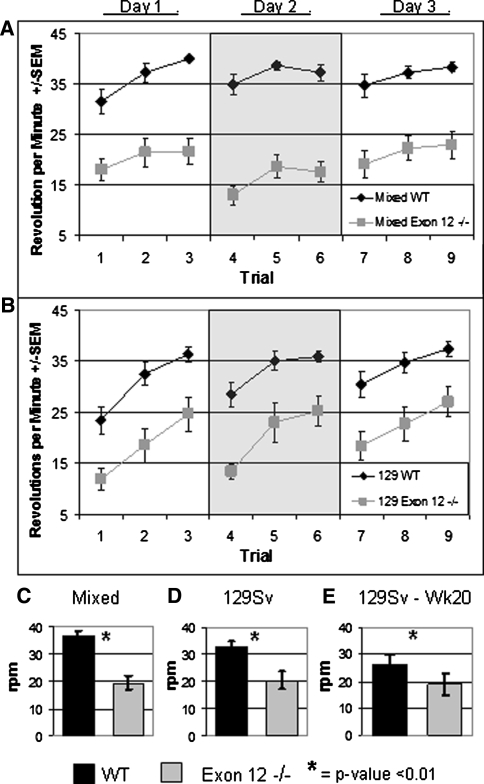
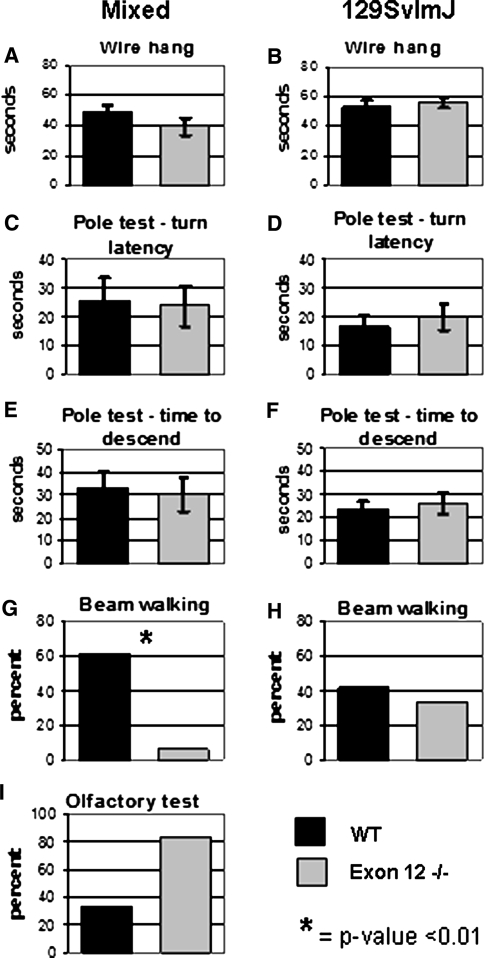
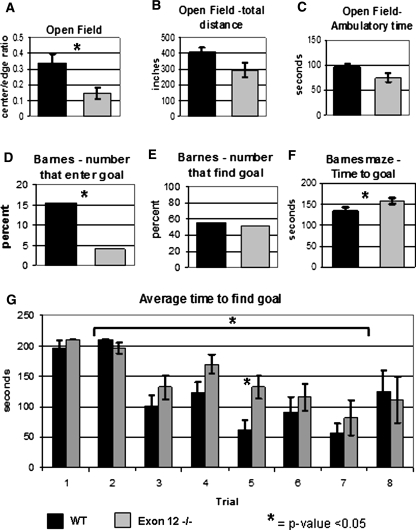
Members of the CHD protein family play key roles in gene regulation through ATP-dependent chromatin remodeling. This is facilitated by chromodomains that bind histone tails, and by the SWI2/SNF2-like ATPase/helicase domain that remodels chromatin by moving histones. Chd6 is ubiquitously expressed in both mouse and human, with the highest levels of expression in the brain. The Chd6 gene contains 37 exons, of which exons 12-19 encode the highly conserved ATPase domain. To determine the biological role of Chd6, we generated mouse lines with a deletion of exon 12. Chd6 without exon 12 is expressed at normal levels in mice, and Chd6 Exon 12 -/- mice are viable, fertile, and exhibit no obvious morphological or pathological phenotype. Chd6 Exon 12 -/- mice lack coordination as revealed by sensorimotor analysis. Further behavioral testing revealed that the coordination impairment was not due to muscle weakness or bradykinesia. Histological analysis of brain morphology revealed no differences between Chd6 Exon 12 -/- mice and wild-type (WT) controls. The location of CHD6 on human chromosome 20q12 is overlapped by the linkage map regions of several human ataxias, including autosomal recessive infantile cerebellar ataxia (SCAR6), a nonprogressive cerebrospinal ataxia. The genomic location, expression pattern, and ataxic phenotype of Chd6 Exon 12 -/- mice indicate that mutations within CHD6 may be responsible for one of these ataxias.
Figures
Similar articles
-
CHD6 promotes broad nucleosome eviction for transcriptional activation in prostate cancer cells.Nucleic Acids Res. 2022 Nov 28;50(21):12186-12201. doi: 10.1093/nar/gkac1090. Nucleic Acids Res. 2022. PMID: 36408932 Free PMC article.
-
CHD6 is a DNA-dependent ATPase and localizes at nuclear sites of mRNA synthesis.FEBS Lett. 2006 Oct 30;580(25):5851-7. doi: 10.1016/j.febslet.2006.09.049. Epub 2006 Oct 2. FEBS Lett. 2006. PMID: 17027977
-
The ATP-dependent chromatin remodeling enzymes CHD6, CHD7, and CHD8 exhibit distinct nucleosome binding and remodeling activities.J Biol Chem. 2017 Jul 14;292(28):11927-11936. doi: 10.1074/jbc.M117.779470. Epub 2017 May 21. J Biol Chem. 2017. PMID: 28533432 Free PMC article.
-
CHD6 chromatin remodeler is a negative modulator of influenza virus replication that relocates to inactive chromatin upon infection.Cell Microbiol. 2011 Dec;13(12):1894-906. doi: 10.1111/j.1462-5822.2011.01679.x. Epub 2011 Sep 30. Cell Microbiol. 2011. PMID: 21899694
-
CHD chromatin remodelling enzymes and the DNA damage response.Mutat Res. 2013 Oct;750(1-2):31-44. doi: 10.1016/j.mrfmmm.2013.07.008. Epub 2013 Aug 14. Mutat Res. 2013. PMID: 23954449 Review.
Cited by
-
CHD6 promotes broad nucleosome eviction for transcriptional activation in prostate cancer cells.Nucleic Acids Res. 2022 Nov 28;50(21):12186-12201. doi: 10.1093/nar/gkac1090. Nucleic Acids Res. 2022. PMID: 36408932 Free PMC article.
-
Overarching control of autophagy and DNA damage response by CHD6 revealed by modeling a rare human pathology.Nat Commun. 2021 May 21;12(1):3014. doi: 10.1038/s41467-021-23327-1. Nat Commun. 2021. PMID: 34021162 Free PMC article.
-
The chromatin remodeler CHD6 promotes colorectal cancer development by regulating TMEM65-mediated mitochondrial dynamics via EGF and Wnt signaling.Cell Discov. 2022 Dec 6;8(1):130. doi: 10.1038/s41421-022-00478-z. Cell Discov. 2022. PMID: 36473865 Free PMC article.
-
Advances in Genetics and Epigenetics of Developmental Coordination Disorder in Children.Brain Sci. 2023 Jun 11;13(6):940. doi: 10.3390/brainsci13060940. Brain Sci. 2023. PMID: 37371418 Free PMC article. Review.
-
Genetic Variability of the Functional Domains of Chromodomains Helicase DNA-Binding (CHD) Proteins.Genes (Basel). 2021 Nov 19;12(11):1827. doi: 10.3390/genes12111827. Genes (Basel). 2021. PMID: 34828433 Free PMC article. Review.
References
-
- Aasland R, Stewart AF, Gibson T. The SANT domain: a putative DNA-binding domain in the SWI-SNF and ADA complexes, the transcriptional co-repressor N-CoR and TFIIIB. Trends Biochem Sci. 1996;21:87–88. - PubMed
-
- Bennetts JS, Rendtorff ND, Simpson F, Tranebjaerg L, Wicking C. The coding region of TP53INP2, a gene expressed in the developing nervous system, is not altered in a family with autosomal recessive non-progressive infantile ataxia on chromosome 20q11–q13. Dev Dyn. 2007;236:843–852. doi: 10.1002/dvdy.21064. - DOI - PubMed
Publication types
MeSH terms
Substances
Grants and funding
LinkOut - more resources
Full Text Sources
Molecular Biology Databases
