

Proteomic analysis of iron acquisition, metabolic and regulatory responses of Yersinia pestis to iron starvation
- PMID: 20113483
- PMCID: PMC2835676
- DOI: 10.1186/1471-2180-10-30
Proteomic analysis of iron acquisition, metabolic and regulatory responses of Yersinia pestis to iron starvation
Abstract
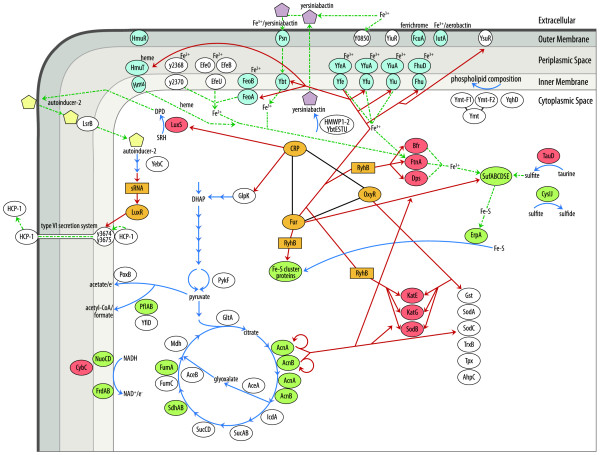
Background: The Gram-negative bacterium Yersinia pestis is the causative agent of the bubonic plague. Efficient iron acquisition systems are critical to the ability of Y. pestis to infect, spread and grow in mammalian hosts, because iron is sequestered and is considered part of the innate host immune defence against invading pathogens. We used a proteomic approach to determine expression changes of iron uptake systems and intracellular consequences of iron deficiency in the Y. pestis strain KIM6+ at two physiologically relevant temperatures (26 degrees C and 37 degrees C).
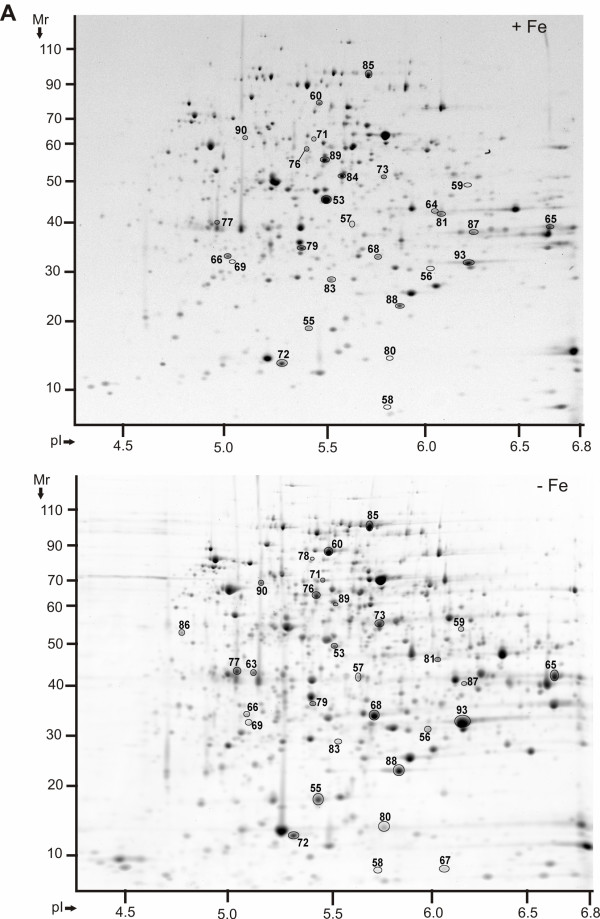
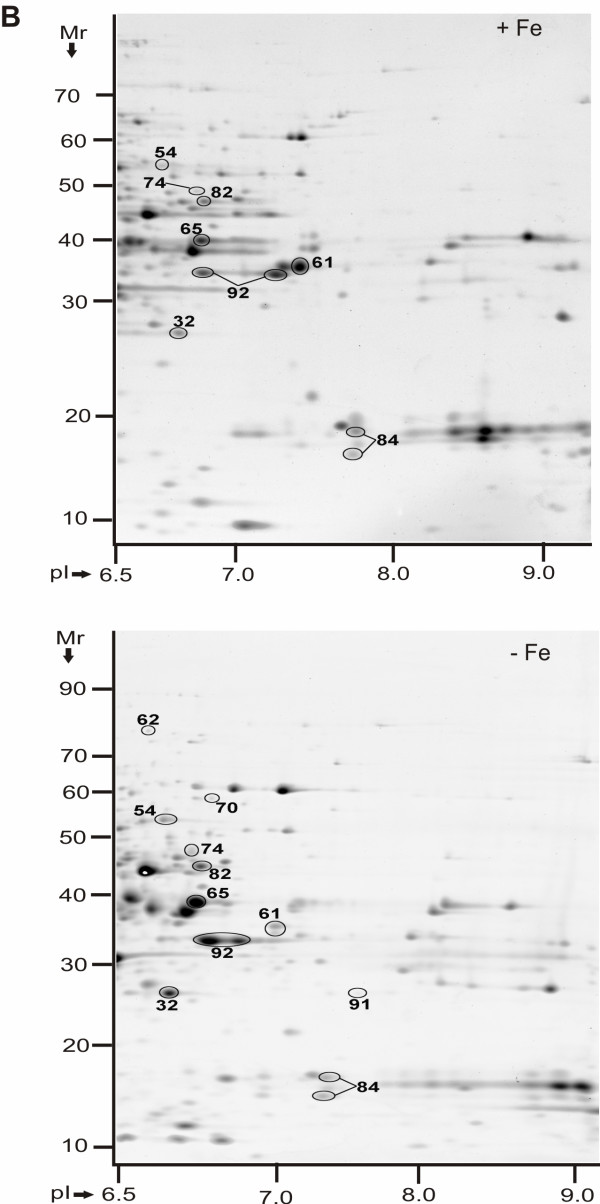
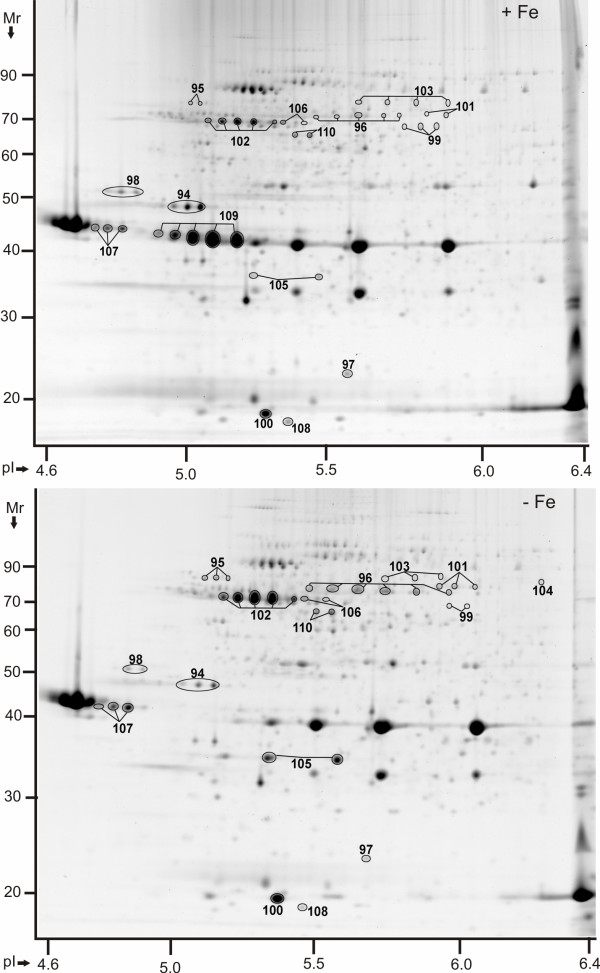
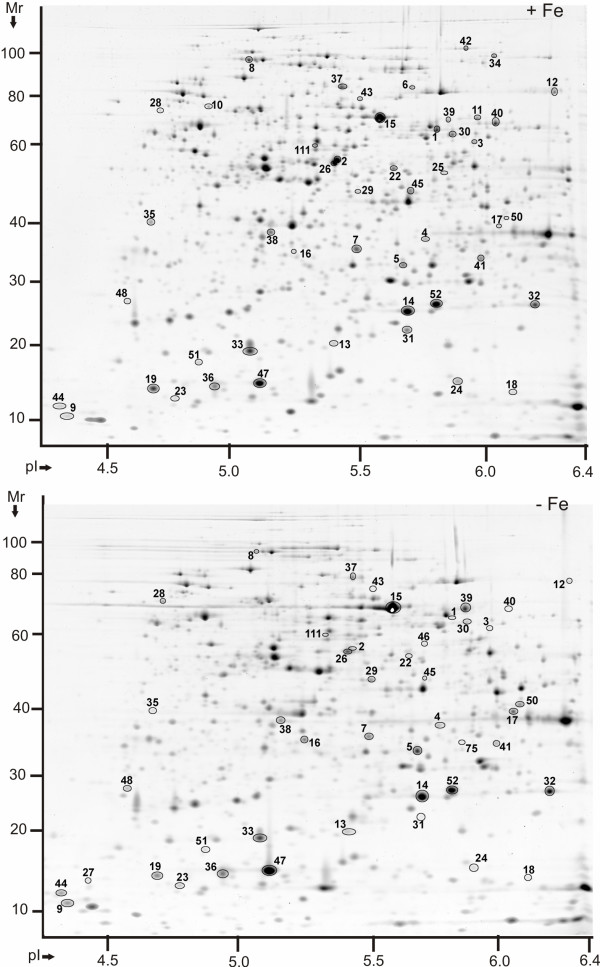
Results: Differential protein display was performed for three Y. pestis subcellular fractions. Five characterized Y. pestis iron/siderophore acquisition systems (Ybt, Yfe, Yfu, Yiu and Hmu) and a putative iron/chelate outer membrane receptor (Y0850) were increased in abundance in iron-starved cells. The iron-sulfur (Fe-S) cluster assembly system Suf, adapted to oxidative stress and iron starvation in E. coli, was also more abundant, suggesting functional activity of Suf in Y. pestis under iron-limiting conditions. Metabolic and reactive oxygen-deactivating enzymes dependent on Fe-S clusters or other iron cofactors were decreased in abundance in iron-depleted cells. This data was consistent with lower activities of aconitase and catalase in iron-starved vs. iron-rich cells. In contrast, pyruvate oxidase B which metabolizes pyruvate via electron transfer to ubiquinone-8 for direct utilization in the respiratory chain was strongly increased in abundance and activity in iron-depleted cells.
Conclusions: Many protein abundance differences were indicative of the important regulatory role of the ferric uptake regulator Fur. Iron deficiency seems to result in a coordinated shift from iron-utilizing to iron-independent biochemical pathways in the cytoplasm of Y. pestis. With growth temperature as an additional variable in proteomic comparisons of the Y. pestis fractions (26 degrees C and 37 degrees C), there was little evidence for temperature-specific adaptation processes to iron starvation.
Figures
Similar articles
-
Hierarchy of iron uptake systems: Yfu and Yiu are functional in Yersinia pestis.Infect Immun. 2006 Nov;74(11):6171-8. doi: 10.1128/IAI.00874-06. Epub 2006 Sep 5. Infect Immun. 2006. PMID: 16954402 Free PMC article.
-
Characterization of the Yersinia pestis Yfu ABC inorganic iron transport system.Infect Immun. 2001 May;69(5):2829-37. doi: 10.1128/IAI.67.5.2829-2837.2001. Infect Immun. 2001. PMID: 11292695 Free PMC article.
-
Yersiniabactin from Yersinia pestis: biochemical characterization of the siderophore and its role in iron transport and regulation.Microbiology (Reading). 1999 May;145 ( Pt 5):1181-1190. doi: 10.1099/13500872-145-5-1181. Microbiology (Reading). 1999. PMID: 10376834
-
Overview of Yersinia pestis Metallophores: Yersiniabactin and Yersinopine.Biology (Basel). 2023 Apr 14;12(4):598. doi: 10.3390/biology12040598. Biology (Basel). 2023. PMID: 37106798 Free PMC article. Review.
-
The role of transition metal transporters for iron, zinc, manganese, and copper in the pathogenesis of Yersinia pestis.Metallomics. 2015 Jun;7(6):965-78. doi: 10.1039/c4mt00332b. Metallomics. 2015. PMID: 25891079 Free PMC article. Review.
Cited by
-
Omics strategies for revealing Yersinia pestis virulence.Front Cell Infect Microbiol. 2012 Dec 13;2:157. doi: 10.3389/fcimb.2012.00157. eCollection 2012. Front Cell Infect Microbiol. 2012. PMID: 23248778 Free PMC article. Review.
-
Iron Acquisition Systems of Gram-negative Bacterial Pathogens Define TonB-Dependent Pathways to Novel Antibiotics.Chem Rev. 2021 May 12;121(9):5193-5239. doi: 10.1021/acs.chemrev.0c01005. Epub 2021 Mar 16. Chem Rev. 2021. PMID: 33724814 Free PMC article. Review.
-
Quantitative proteomic analysis of cell envelope preparations under iron starvation stress in Aeromonas hydrophila.BMC Microbiol. 2016 Jul 22;16(1):161. doi: 10.1186/s12866-016-0769-5. BMC Microbiol. 2016. PMID: 27448791 Free PMC article.
-
Yersiniomics, a Multi-Omics Interactive Database for Yersinia Species.Microbiol Spectr. 2023 Feb 27;11(2):e0382622. doi: 10.1128/spectrum.03826-22. Online ahead of print. Microbiol Spectr. 2023. PMID: 36847572 Free PMC article.
-
Proteomic profiling of the influence of iron availability on Cryptococcus gattii.J Proteome Res. 2012 Jan 1;11(1):189-205. doi: 10.1021/pr2005296. Epub 2011 Oct 26. J Proteome Res. 2012. PMID: 21970549 Free PMC article.
References
-
- Brubaker RR, Sussman M. Molecular Medical Microbiology. Vol. 3. London, UK: Academic Press; 2002. Yersinia pestis; pp. 2033–2058. full_text.
-
- Hinnebusch BJ. In: Yersinia Molecular and Cellular Biology. Carniel EaH BJ, editor. Norfolk, U.K.: Horizon Bioscience; 2004. The evolution of flea-borne transmission of Yersinia pestis; pp. 49–73.
Publication types
MeSH terms
Substances
Grants and funding
LinkOut - more resources
Full Text Sources
Medical
Miscellaneous
