

Ultrasound imaging in an experimental model of fatty liver disease and cirrhosis in rats
- PMID: 20113491
- PMCID: PMC2835689
- DOI: 10.1186/1746-6148-6-6
Ultrasound imaging in an experimental model of fatty liver disease and cirrhosis in rats
Abstract
Background: Domestic dogs and cats are very well known to develop chronic hepatic diseases, including hepatic lipidosis and cirrhosis. Ultrasonographic examination is extensively used to detect them. However, there are still few reports on the use of the ultrasound B-mode scan in correlation with histological findings to evaluate diffuse hepatic changes in rodents, which represent the most important animal group used in experimental models of liver diseases. The purpose of this study was to determine the reliability of ultrasound findings in the assessment of fatty liver disease and cirrhosis when compared to histological results in Wistar rats by following up a murine model of chronic hepatic disease.
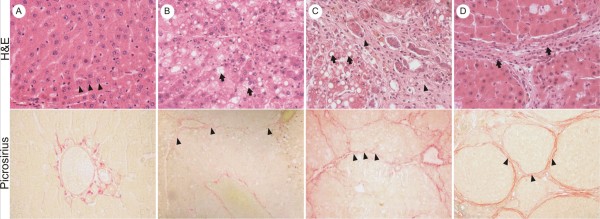
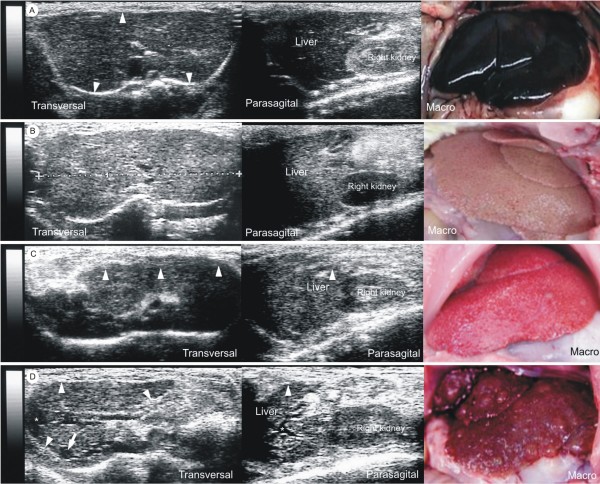
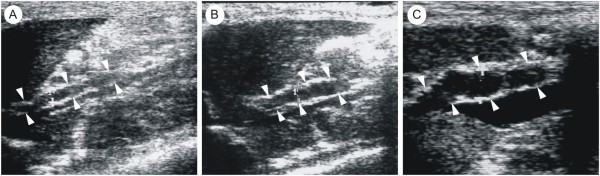
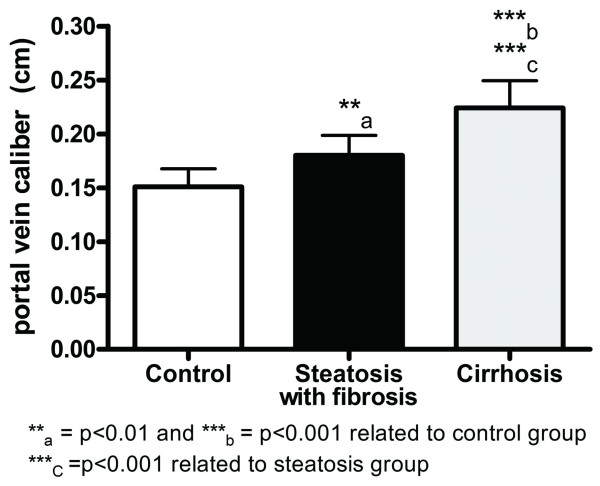
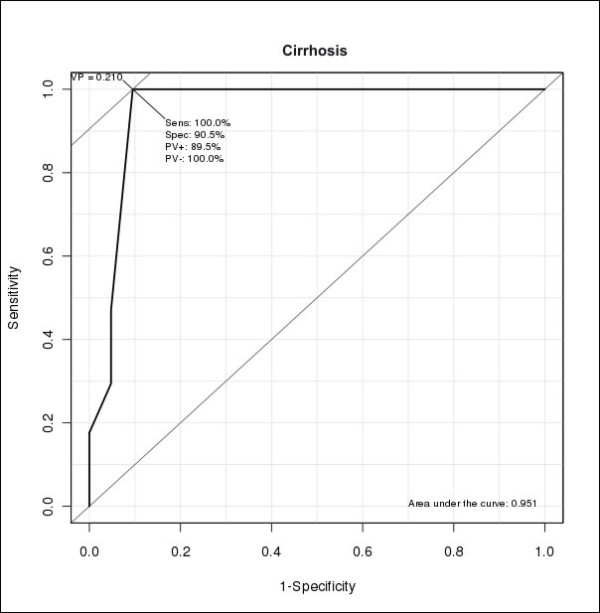
Results: Forty Wistar rats (30 treated, 10 controls) were included. Liver injury was induced by dual exposure to CCl4 and ethanol for 4, 8 and 15 weeks. Liver echogenicity, its correlation to the right renal cortex echogenicity, measurement of portal vein diameter (PVD) and the presence of ascites were evaluated and compared to histological findings of hepatic steatosis and cirrhosis. Liver echogenicity correlated to hepatic steatosis when it was greater or equal to the right renal cortex echogenicity, with a sensitivity of 90%, specificity of 100%, positive and negative predictive values of 100% and 76.9% respectively, and accuracy of 92.5%. Findings of heterogeneous liver echogenicity and irregular surface correlated to liver cirrhosis with a sensitivity of 70.6%, specificity of 100%, positive and negative predictive values of 100% and 82.1% respectively, and accuracy of 87.5%. PVD was significantly increased in both steatotic and cirrhotic rats; however, the later had greater diameters. PVD cut-off point separating steatosis from cirrhosis was 2.1 mm (sensitivity of 100% and specificity of 90.5%). One third of cirrhotic rats presented with ascites.
Conclusion: The use of ultrasound imaging in the follow-up of murine diffuse liver disease models is feasible and efficient, especially when the studied parameters are used in combination. The potential implication of this study is to provide a non-invasive method that allows follow-up studies of fatty liver disease and cirrhosis of individual rats for pre-clinical drug or cell based therapies.
Figures
Similar articles
-
Noninvasive assessment of liver steatosis, fibrosis and inflammation in chronic hepatitis C virus infection.Liver Int. 2005 Dec;25(6):1150-5. doi: 10.1111/j.1478-3231.2005.01164.x. Liver Int. 2005. PMID: 16343065
-
Doppler Ultrasound in Liver Cirrhosis: Correlation of Hepatic Artery and Portal Vein Measurements With Model for End-Stage Liver Disease Score.J Ultrasound Med. 2017 Apr;36(4):725-730. doi: 10.7863/ultra.16.03107. Epub 2016 Dec 27. J Ultrasound Med. 2017. PMID: 28026900
-
Bone marrow cell transplant does not prevent or reverse murine liver cirrhosis.Cell Transplant. 2008;17(8):943-53. doi: 10.3727/096368908786576453. Cell Transplant. 2008. PMID: 19069636
-
The value of Doppler ultrasound in cirrhosis and portal hypertension.Scand J Gastroenterol Suppl. 1999;230:82-8. doi: 10.1080/003655299750025598. Scand J Gastroenterol Suppl. 1999. PMID: 10499467 Review.
-
The controlled attenuation parameter (CAP): a novel tool for the non-invasive evaluation of steatosis using Fibroscan.Clin Res Hepatol Gastroenterol. 2012 Feb;36(1):13-20. doi: 10.1016/j.clinre.2011.08.001. Epub 2011 Sep 15. Clin Res Hepatol Gastroenterol. 2012. PMID: 21920839 Review.
Cited by
-
B-mode ultrasound for the assessment of hepatic fibrosis: a quantitative multiparametric analysis for a radiomics approach.Sci Rep. 2019 Jun 18;9(1):8708. doi: 10.1038/s41598-019-45043-z. Sci Rep. 2019. PMID: 31213661 Free PMC article.
-
Hepatic inflammation scores correlate with common carotid intima-media thickness in rats with NAFLD induced by a high-fat diet.BMC Vet Res. 2014 Jul 16;10:162. doi: 10.1186/1746-6148-10-162. BMC Vet Res. 2014. PMID: 25030203 Free PMC article.
-
Sonographic assessment of petroleum-induced hepatotoxicity in Nigerians: does biochemical assessment underestimate liver damage?Afr Health Sci. 2017 Mar;17(1):270-277. doi: 10.4314/ahs.v17i1.33. Afr Health Sci. 2017. PMID: 29026402 Free PMC article.
-
Integrated Ultrasound Characterization of the Diet-Induced Obesity (DIO) Model in Young Adult c57bl/6j Mice: Assessment of Cardiovascular, Renal and Hepatic Changes.J Imaging. 2024 Sep 4;10(9):217. doi: 10.3390/jimaging10090217. J Imaging. 2024. PMID: 39330437 Free PMC article.
-
Novel Approach for Evaluation of Bacteroides fragilis Protective Role against Bartonella henselae Liver Damage in Immunocompromised Murine Model.Front Microbiol. 2016 Nov 7;7:1750. doi: 10.3389/fmicb.2016.01750. eCollection 2016. Front Microbiol. 2016. PMID: 27872616 Free PMC article.
References
-
- Yeager AE, Mohammed H. Accuracy of ultrasonography in the detection of severe hepatic lipidosis in cats. Am J Vet Res. 1992;53:597–599. - PubMed
-
- Center AS, Crawford MA, Guida L, Erb HN, King J. A retrospective study of 77 cats with severe hepatic lipidosis: 1975-1990. J Vet Intern Med. 1993;7:349–359. - PubMed
-
- Scarlett JM, Donoghue S, Saidla J, Wills J. Overweight cats: prevalence and risk factors. Int J Obes Relat Metab Disord. 1994;18(Suppl 1):22–28. - PubMed
-
- Cornelius LM, DeNovo RC. In: Current veterinary therapy. 8. KirK RW, editor. Philadelphia: WB Saunders Co; 1983. Icterus in Cat; pp. 822–827.
Publication types
MeSH terms
Substances
LinkOut - more resources
Full Text Sources
Medical
Miscellaneous
