

From learning taxonomies to phylogenetic learning: integration of 16S rRNA gene data into FAME-based bacterial classification
- PMID: 20113515
- PMCID: PMC2828439
- DOI: 10.1186/1471-2105-11-69
From learning taxonomies to phylogenetic learning: integration of 16S rRNA gene data into FAME-based bacterial classification
Abstract
Background: Machine learning techniques have shown to improve bacterial species classification based on fatty acid methyl ester (FAME) data. Nonetheless, FAME analysis has a limited resolution for discrimination of bacteria at the species level. In this paper, we approach the species classification problem from a taxonomic point of view. Such a taxonomy or tree is typically obtained by applying clustering algorithms on FAME data or on 16S rRNA gene data. The knowledge gained from the tree can then be used to evaluate FAME-based classifiers, resulting in a novel framework for bacterial species classification.
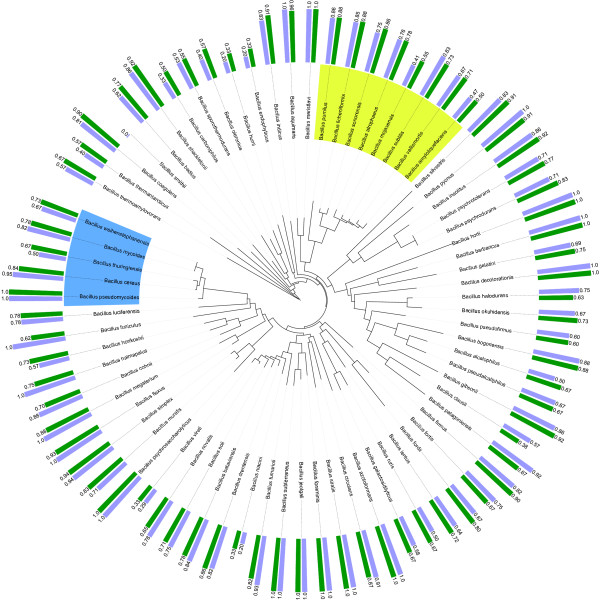
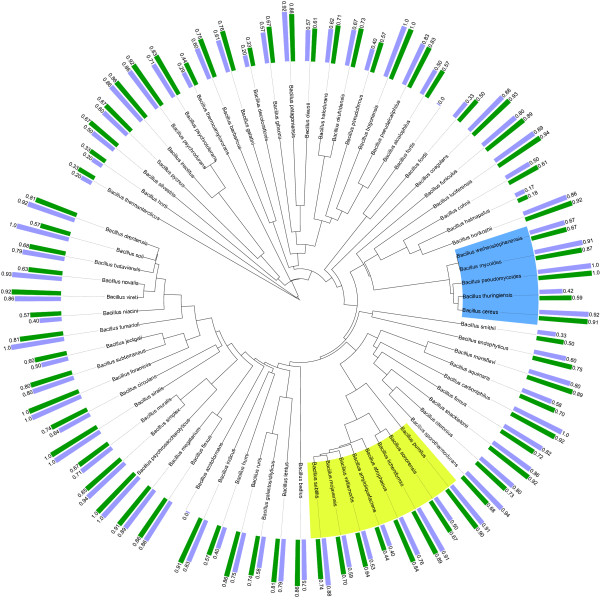
Results: In view of learning in a taxonomic framework, we consider two types of trees. First, a FAME tree is constructed with a supervised divisive clustering algorithm. Subsequently, based on 16S rRNA gene sequence analysis, phylogenetic trees are inferred by the NJ and UPGMA methods. In this second approach, the species classification problem is based on the combination of two different types of data. Herein, 16S rRNA gene sequence data is used for phylogenetic tree inference and the corresponding binary tree splits are learned based on FAME data. We call this learning approach 'phylogenetic learning'. Supervised Random Forest models are developed to train the classification tasks in a stratified cross-validation setting. In this way, better classification results are obtained for species that are typically hard to distinguish by a single or flat multi-class classification model.
Conclusions: FAME-based bacterial species classification is successfully evaluated in a taxonomic framework. Although the proposed approach does not improve the overall accuracy compared to flat multi-class classification, it has some distinct advantages. First, it has better capabilities for distinguishing species on which flat multi-class classification fails. Secondly, the hierarchical classification structure allows to easily evaluate and visualize the resolution of FAME data for the discrimination of bacterial species. Summarized, by phylogenetic learning we are able to situate and evaluate FAME-based bacterial species classification in a more informative context.
Figures


Similar articles
-
The All-Species Living Tree project: a 16S rRNA-based phylogenetic tree of all sequenced type strains.Syst Appl Microbiol. 2008 Sep;31(4):241-50. doi: 10.1016/j.syapm.2008.07.001. Epub 2008 Aug 9. Syst Appl Microbiol. 2008. PMID: 18692976
-
Towards large-scale FAME-based bacterial species identification using machine learning techniques.Syst Appl Microbiol. 2009 May;32(3):163-76. doi: 10.1016/j.syapm.2009.01.003. Epub 2009 Feb 23. Syst Appl Microbiol. 2009. PMID: 19237256
-
Bacterial phylogeny based on 16S and 23S rRNA sequence analysis.FEMS Microbiol Rev. 1994 Oct;15(2-3):155-73. doi: 10.1111/j.1574-6976.1994.tb00132.x. FEMS Microbiol Rev. 1994. PMID: 7524576 Review.
-
RNA polymerase beta subunit (rpoB) gene and the 16S-23S rRNA intergenic transcribed spacer region (ITS) as complementary molecular markers in addition to the 16S rRNA gene for phylogenetic analysis and identification of the species of the family Mycoplasmataceae.Mol Phylogenet Evol. 2012 Jan;62(1):515-28. doi: 10.1016/j.ympev.2011.11.002. Epub 2011 Nov 17. Mol Phylogenet Evol. 2012. PMID: 22115576
-
[Actual problems of bacteria phylogenetic classification].Mikrobiol Z. 2003 Sep-Oct;65(5):46-65. Mikrobiol Z. 2003. PMID: 14723163 Review. Russian.
Cited by
-
The use of FAME analyses to discriminate between different strains of Geotrichum klebahnii with different viabilities.World J Microbiol Biotechnol. 2012 Feb;28(2):755-9. doi: 10.1007/s11274-011-0847-7. Epub 2011 Jul 17. World J Microbiol Biotechnol. 2012. PMID: 22806872
-
Taxometer: Improving taxonomic classification of metagenomics contigs.Nat Commun. 2024 Sep 27;15(1):8357. doi: 10.1038/s41467-024-52771-y. Nat Commun. 2024. PMID: 39333501 Free PMC article.
-
Molecular identification and diversity analysis of dental bacteria in diabetic and non-diabetic females from Saudi Arabia.Saudi J Biol Sci. 2020 Jan;27(1):358-362. doi: 10.1016/j.sjbs.2019.10.005. Epub 2019 Oct 22. Saudi J Biol Sci. 2020. PMID: 31889858 Free PMC article.
-
Translational utility of a hierarchical classification strategy in biomolecular data analytics.Sci Rep. 2017 Nov 3;7(1):14981. doi: 10.1038/s41598-017-14092-7. Sci Rep. 2017. PMID: 29101330 Free PMC article.
-
Degradation study of lindane by novel strains Kocuria sp. DAB-1Y and Staphylococcus sp. DAB-1W.Bioresour Bioprocess. 2016;3(1):53. doi: 10.1186/s40643-016-0130-8. Epub 2016 Dec 28. Bioresour Bioprocess. 2016. PMID: 28090433 Free PMC article.
References
-
- Kunitsky C, Osterhout G, Sasser M. In: Encyclopedia of Rapid Microbiological Methods. Miller M, editor. Vol. 3. Bethesda: PDA; 2006. Identification of microorganisms using fatty acid methyl ester (FAME) analysis and the MIDI Sherlock Microbial Identification System; pp. 1–18.
-
- Slabbinck B, Gillis W, Dawyndt P, De Vos P, De Baets B. FAME-bank.net: a public database for bacterial FAME profiles. http://www.fame-bank.net
-
- Slabbinck B, De Baets B, Dawyndt P, De Vos P. Genus-wide Bacillus species identification through proper artificial neural network experiments on fatty acid profiles. Antonie van Leeuwenhoek International Journal of General and Molecular Microbiology. 2008;94(2):187–198. doi: 10.1007/s10482-008-9229-z. - DOI - PubMed
Publication types
MeSH terms
Substances
LinkOut - more resources
Full Text Sources
Miscellaneous
