. 2010 Feb 1:9:24.
doi: 10.1186/1476-4598-9-24.

Differential roles of cyclin D1 and D3 in pancreatic ductal adenocarcinoma

Affiliations

Differential roles of cyclin D1 and D3 in pancreatic ductal adenocarcinoma

Nikolina Radulovich et al. Mol Cancer. .

Abstract

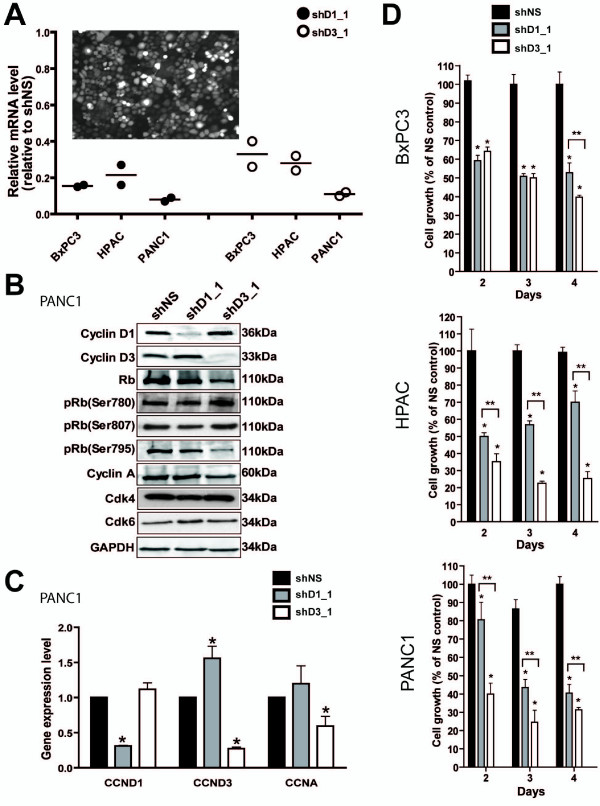
Background: The cyclin D1 (CCND1) and cyclin D3 (CCND3) are frequently co-overexpressed in pancreatic ductal adenocarcinoma (PDAC). Here we examine their differential roles in PDAC.

Results: CCND1 and CCND3 expression were selectively suppressed by shRNA in PDAC cell lines with expression levels of equal CCND1 and CCND3 (BxPC3), enhanced CCND1 (HPAC) or enhanced CCND3 (PANC1). Suppression of cell proliferation was greater with CCND3 than CCND1 downregulation. CCND3 suppression led to a reduced level of phosphorylated retinoblastoma protein (Ser795p-Rb/p110) and resulted in decreased levels of cyclin A mRNA and protein. A global gene expression analysis identified deregulated genes in D1- or D3-cyclin siRNA-treated PANC1 cells. The downregulated gene targets in CCND3 suppressed cells were significantly enriched in cell cycle associated processes (p < 0.005). In contrast, focal adhesion/actin cytoskeleton, MAPK and NF B signaling appeared to characterize the target genes and their interacting proteins in CCND1 suppressed PANC1 cells.

Conclusions: Our results suggest that CCND3 is the primary driver of the cell cycle, in cooperation with CCND1 that integrates extracellular mitogenic signaling. We also present evidence that CCND1 plays a role in tumor cell migration. The results provide novel insights for common and differential targets of CCND1 and CCND3 overexpression during pancreatic duct cell carcinogenesis.


Figures

Figure 1
Figure 1
Cyclin D1/D3 suppression effects on cell cycle and proliferation. (A) The expression of lentiviral shD1_1 or shD3_1 decreases the mRNA of D1- or D3-cyclin, respectively in BxPC3, HPAC and PANC1 cells. Bars represent medians. The insert is a representative image of shNS_YFP transduced PANC1 cells (insert). (B) Immunoblots show effects of shD1_1, shD3_1 or non-specific shNS on cell cycle-specific proteins D-cyclins, Rb, cyclin A (CCNA) and equal loading control GAPDH in PANC1 cells. (C) Differential effects of shD1_1 or shD3_1 expression on mRNA levels of the D-cyclins and cyclin A in PANC1 cells. (D) Proliferation was decreased in all three cell lines over a period of 4 days after 2 days transduction with shD1_1 or shD3_1 compared with shNS. Values are mean ± standard error. An asterisk (*) designates significant differences between test and control samples (p < 0.001, two-way RM ANOVA and Bonferroni posttests). Significantly different tested pairs are designated by brackets.
Figure 2
Figure 2
D-cyclin suppression induces senescence. (A) Representative images show transduced YFP expressing PANC1 cells, 20 days post-transduction. Arrows indicate YFP cells of large senescent-like morphology that were quantified (B), bars are mean ± standard error. (C) A representative image shows that larger cells of shD3_1 transduced PANC1 display senescence associated β-galactosidase activity (arrows). Scale bars designate 20 μm.
Figure 3
Figure 3
Levels of gene expression changes were similar using either microarray or quantitative PCR (QPCR) assays. Comparison was performed on 20 target genes that were downregulated in PANC1 cells treated with (A) CCND1 siRNA or (B) CCND3 siRNA. A subset of genes was selected to determine expression levels in all three cell lines (PANC1, BxPC3 and HPAC) after suppression of CCND1 or CCND3.
Figure 4
Figure 4
Cyclin D3-specific deregulated genes and their functional networks. A protein-protein interaction (PPI) network shows proteins corresponding to deregulated genes in CCND3 siRNA-treated cells and their interacting proteins obtained from I2D protein interaction database ver. 1.7 [23] annotated to the cell cycle process. Target genes/proteins whose expression is up-regulated or down-regulated (up/downward triangle nodes, respectively) by at least 2-fold compared with control and their interacting proteins (round nodes) are annotated by either GO cell cycle term (pink nodes, GO:0007049), KEGG cell cycle pathway (green nodes, KEGG hsa4110), common to both annotations (orange nodes), or none of the above (grey nodes). Target nodes positions reflect their interactions with cell cycle annotated nodes (colored), connecting directly to the annotated nodes or via intermediate node(s). Nodes and edges not directly connecting target nodes to pathway-annotated interacting nodes were faded out to reduce network complexity. This network incorporates 37/72 deregulated genes from CCND3 siRNA-treated cells; 36 proteins form a single connected network. A single target IFIT2 was identified in I2D, but did not connect to the other nodes at the depth of the presented network. PPI network analysis was done using NAViGaTOR 1.13 ([26]; http://ophid.utoronto.ca/navigator).
Figure 5
Figure 5
Cyclin D1-specific deregulated genes are connected to focal adhesion and actin skeleton network. (A) The PPI network shows 81 proteins corresponding to deregulated genes from CCND1 siRNA-treated cells by at least 2-fold compared with control and their interacting proteins obtained from I2D database constitute a single connected network with 79 proteins. Target nodes positions reflect their interactions with pathway-annotated nodes (colored), connecting directly to the annotated nodes or via intermediate node(s). Nodes and edges not directly connecting target nodes to pathway-annotated interacting nodes were faded out to reduce network complexity. Target genes/proteins whose expression is up-regulated or down-regulated (up/downward triangle nodes, respectively) and their interacting proteins (round nodes) are annotated by focal adhesion pathway (blue nodes, KEGG hsa4510), actin cytoskeleton organization and biogenesis (green nodes, GO:0030036), common proteins to both annotations (turquoise nodes), or none of the above (grey nodes). Two proteins, FLRT2 and TMPRSS2, are identified in I2D, but did not connect to the other nodes at depth of the presented network. (B) Collagen type IV migration is decreased in BxPC3 and HPAC cells stably expressing shD1_1 compared with control shNS. Representative plots are shown of two repeated experiments completed in duplicate. A significant difference, p < 0.05, in migration between treatments shNS and shD1 or shD3 for each cell line is indicated with an asterisk (*), or between a pair of treatments was indicated with a bracket and asterisks. (C) mRNA levels of CCND1 in PANC1 cells transfected with pBMN compared to pBMN_CCND1 vector are significantly increased, p < 0.05 (*). (D) Collagen type IV migration is significantly increased, p < 0.05, in PANC1 cells upon transient overexpression of CCND1. PPI network analysis was done using NAViGaTOR 1.13 ([26]; http://ophid.utoronto.ca/navigator).
Figure 6
Figure 6
Cyclin D1-specific deregulated genes are connected to MAPK pathway. (A) PPI network shows target proteins and their interacting partners annotated by the MAPK pathway (brown nodes, KEGG hsa4010), NFκB/I-κB kinase cascade (blue nodes, GO:0007249), common proteins to both annotations (purple nodes), or none of the above (grey nodes). (B) Immunoblots show responses of cyclin D1/D3 levels to the inhibition of ERK activity with UO126 (UO) for 18 hours, and inhibition of PI3K/Akt activity with wortmannin (WM) for 4 hours. GAPDH levels show equal protein loading. (C) The migration through CN IV of untreated control and UO126-treated BxPC3 and HPAC cells are shown from two repeated experiments completed in duplicate. An asterisk designates a significant difference (p < 0.05) between treated cells and the respective control cells.

Similar articles

Cited by

References

    1. Walker JL, Assoian RK. Integrin-dependent signal transduction regulating cyclin D1 expression and G1 phase cell cycle progression. Cancer Metastasis Rev. 2005;24:383–393. doi: 10.1007/s10555-005-5130-7. - DOI - PubMed
    1. Swanton C. Cell-cycle targeted therapies. Lancet Oncol. 2004;5:27–36. doi: 10.1016/S1470-2045(03)01321-4. - DOI - PubMed
    1. Sirivatanauksorn V, Sirivatanauksorn Y, Lemoine NR. Molecular pattern of ductal pancreatic cancer. Langenbecks Arch Surg. 1998;383:105–115. - PubMed
    1. Al-Aynati MM, Radulovich N, Ho J, Tsao MS. Overexpression of G1-S cyclins and cyclin-dependent kinases during multistage human pancreatic duct cell carcinogenesis. Clin Cancer Res. 2004;10:6598–6605. doi: 10.1158/1078-0432.CCR-04-0524. - DOI - PubMed
    1. Ebert MP, Hernberg S, Fei G, Sokolowski A, Schulz HU, Lippert H, Malfertheiner P. Induction and expression of cyclin D3 in human pancreatic cancer. J Cancer Res Clin Oncol. 2001;127:449–454. doi: 10.1007/s004320100235. - DOI - PubMed

Publication types

MeSH terms