

A robust method to estimate the intracranial volume across MRI field strengths (1.5T and 3T)
- PMID: 20114082
- PMCID: PMC2883144
- DOI: 10.1016/j.neuroimage.2010.01.064
A robust method to estimate the intracranial volume across MRI field strengths (1.5T and 3T)
Abstract
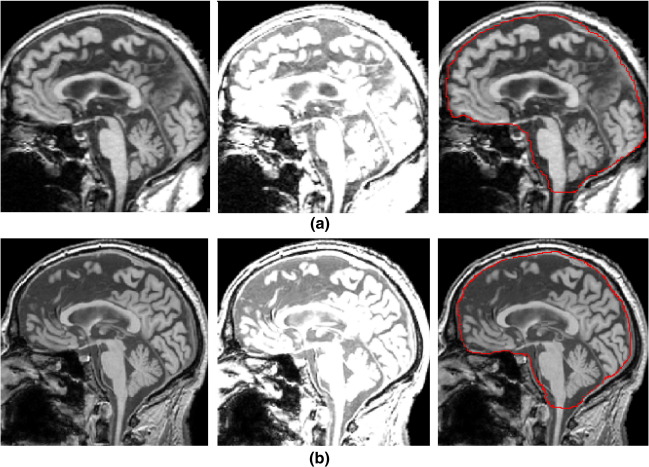
As population-based studies may obtain images from scanners with different field strengths, a method to normalize regional brain volumes according to intracranial volume (ICV) independent of field strength is needed. We found systematic differences in ICV estimation, tested in a cohort of healthy subjects (n=5) that had been imaged using 1.5T and 3T scanners, and confirmed in two independent cohorts. This was related to systematic differences in the intensity of cerebrospinal fluid (CSF), with higher intensities for CSF located in the ventricles compared with CSF in the cisterns, at 3T versus 1.5T, which could not be removed with three different applied bias correction algorithms. We developed a method based on tissue probability maps in MNI (Montreal Neurological Institute) space and reverse normalization (reverse brain mask, RBM) and validated it against manual ICV measurements. We also compared it with alternative automated ICV estimation methods based on Statistical Parametric Mapping (SPM5) and Brain Extraction Tool (FSL). The proposed RBM method was equivalent to manual ICV normalization with a high intraclass correlation coefficient (ICC=0.99) and reliable across different field strengths. RBM achieved the best combination of precision and reliability in a group of healthy subjects, a group of patients with Alzheimer's disease (AD) and mild cognitive impairment (MCI) and can be used as a common normalization framework.
2010 Elsevier Inc. All rights reserved.
Figures


References
-
- Acosta-Cabronero J., Williams G.B., Pereira M.S., Pengas G., Nestor P. The impact of skull-stripping and radio-frequency bias correction on grey-matter segmentation for voxel-based morphometry. NeuroImage. 2008;39(4):1654–1665. - PubMed
-
- Ananth H., Popescu I., Critchley H.D., Good C.D., Frackowiak R.S., Dolan R.J. Cortical and subcortical gray matter abnormalities in schizophrenia determined through structural magnetic resonance imaging with optimized volumetric voxel-based morphometry. Am. J. Psychiatry. 2002;159(9):1497–1505. - PubMed
-
- Arnold J.B., Liow J.S., Schaper K.A., Stern J.J., Sled J.G., Shattuck D.W., Worth A.J., Cohen M.S., Leahy R.M., Mazziotta J.C., Rottenberg D.A. Qualitative and quantitative evaluation of six algorithms for correcting intensity nonuniformity effects. NeuroImage. 2001;13(5):931–943. - PubMed
-
- Ashburner J., Friston K.J. Unified segmentation. NeuroImage. 2005;26(3):839–851. - PubMed
-
- Battaglini M., Smith S.M., Brogi S., De Stefano N. Enhanced brain extraction improves the accuracy of brain atrophy estimation. NeuroImage. 2008;40(2):583–589. - PubMed
Publication types
MeSH terms
Grants and funding
LinkOut - more resources
Full Text Sources
Other Literature Sources
Medical
Research Materials
