. 2010 Mar 12;37(5):679-89.
doi: 10.1016/j.molcel.2010.01.012. Epub 2010 Jan 28.

Distinct phases of siRNA synthesis in an endogenous RNAi pathway in C. elegans soma

Affiliations

Distinct phases of siRNA synthesis in an endogenous RNAi pathway in C. elegans soma

Jonathan I Gent et al. Mol Cell. .

Abstract

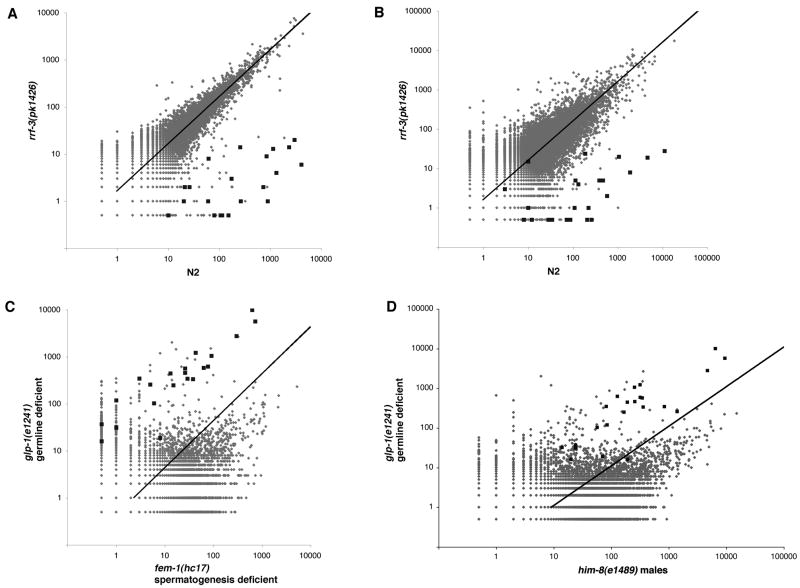
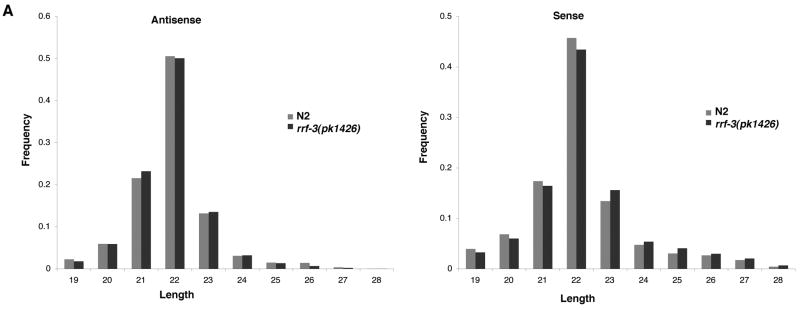
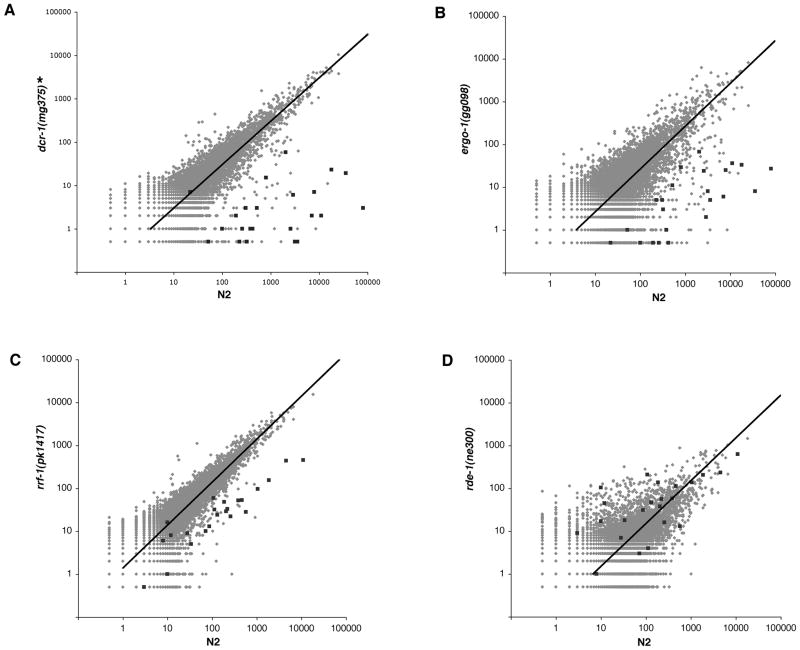
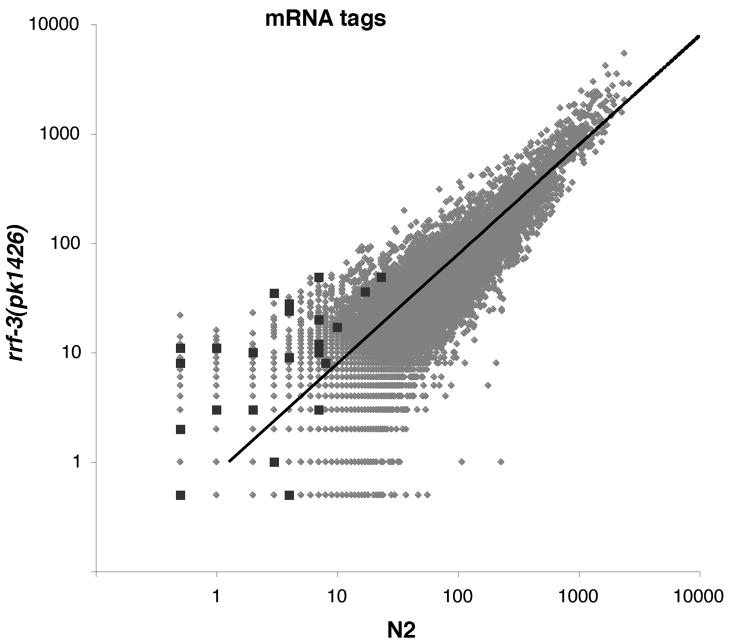
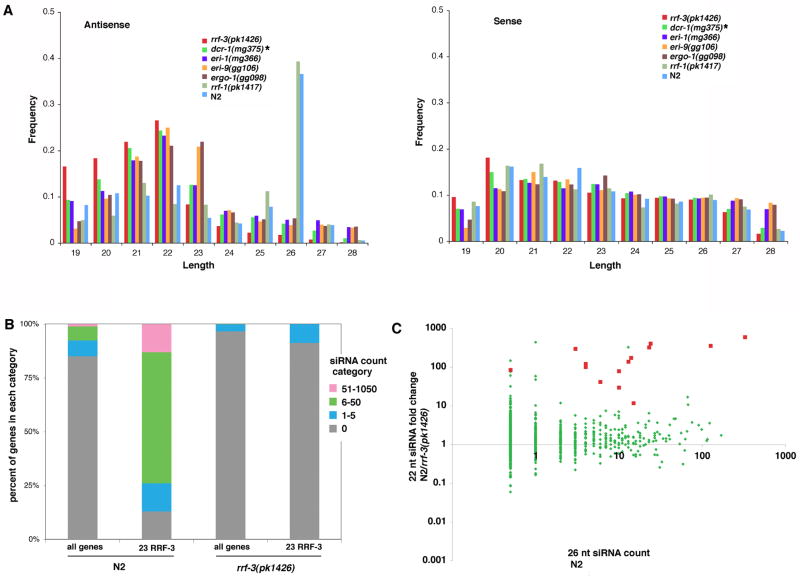
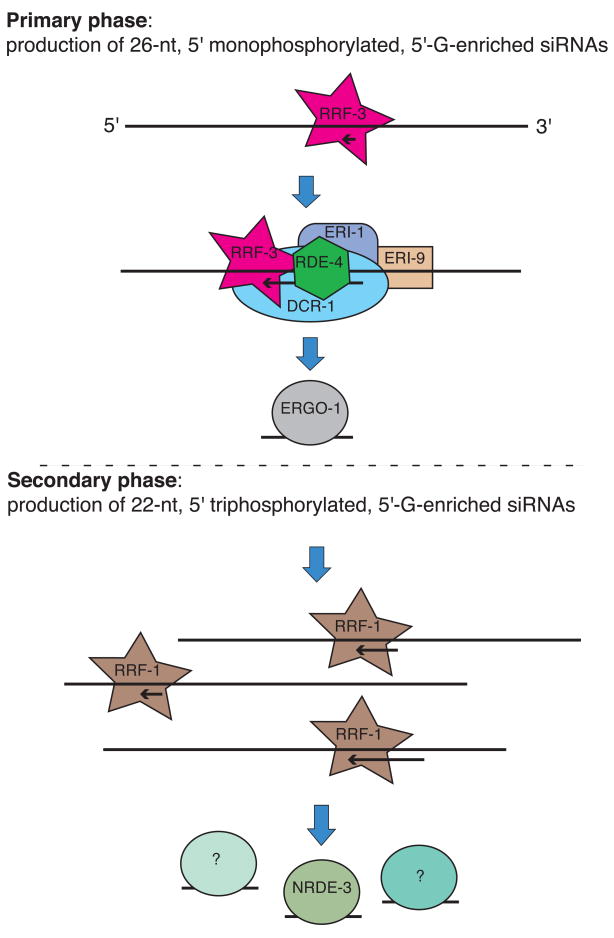
Endogenous RNA-directed RNA polymerases (RdRPs) are cellular components capable of synthesizing new complementary RNAs from existing RNA templates. We present evidence for successive engagement of two different RdRPs in an endogenous siRNA-based mechanism targeting specific mRNAs in C. elegans soma. In the initiation stage of this process, a group of mRNA species are chosen as targets for downregulation, leading to accumulation of rare 26 nt 5'-phosphorylated antisense RNAs that depend on the RdRP homolog RRF-3, the Argonaute ERGO-1, DICER, and a series of associated ("ERI") factors. This primary process leads to production of a much more abundant class of 22 nt antisense RNAs, dependent on a secondary RdRP (RRF-1) and associating with at least one distinct Argonaute (NRDE-3). The requirement for two RdRP/Argonaute combinations and initiation by a rare class of uniquely structured siRNAs in this pathway illustrate the caution and flexibility used as biological systems exploit the physiological copying of RNA.


Figures

Figure 1
Figure 1. Identification of an exemplary set of somatic RRF-3 targets
(A, B) Scatter plots depict comparisons of gene-by-gene siRNA counts from one of the three paired rrf-3 mutant and wildtype samples used to identify RRF-3 target genes (A) and from an independent pair of rrf-3 mutant and wildtype samples (B). The siRNA counts were obtained using a 5′-phosphate-independent small RNA capture and sequencing method. The resulting sequences were aligned to a WS190 cDNA dataset. Each dot s X- and Y-coordinates represents a gene s siRNA count from the indicated samples. The dark squares correspond to the 23 RRF-3 target genes identified by reduced siRNA count in rrf-3 mutant v. wildtype in all three comparisons (at least fivefold reduction with a P-value of less than 0.001). Lighter dots correspond to the rest of the 21133 genes in the cDNA reference dataset. Genes with siRNA counts of zero were assigned a value of 0.5 to avoid exclusion from the plot (axes are in logarithmic scale). The trendline denotes the expected siRNA counts per gene had the samples been derived from identical populations. The trendline varies from the diagonal due to difference in total sequence counts between samples. (C,D) Scatter plots depict gene-by-gene siRNA counts from germline mutants. Germline-deficient glp-1(e2141) animals were compared with female (fem-1(hc17): [C]) and male (him-8(e1489): [D]) animals. The RRF-3 targets (dark squares) and other genes above the trendline have higher relative siRNA abundance in glp-1(e2141) soma-only animals than in either fem-1(hc17) or him-8(e1489) animals with their combined somas and germlines. See also supplementary Figure S1.
Figure 2
Figure 2. Analysis of genome-wide RRF-3 effects on siRNA lengths
Histograms of siRNA length distributions indicate similar enrichment for 22 nt siRNAs from the 5′-phosphate-independent sequence libraries for rrf-3 mutant and wildtype. The reads from the samples represented in Figure 1B were separated based on alignment orientation, and the frequency of each length between 19 and 28 nt tabulated for both antisense (left) and sense (right). See also Figure S2.
Figure 3
Figure 3. Identification of additional RNAi factors in the RRF-3 pathway
(A–D) Scatter plots depict gene-by gene siRNA counts from RNAi mutants and N2 control. Strains carrying mutations in dcr-1 (A), ergo-1 (B), and rrf-1 (C) showed decreased siRNA counts for the 23 RRF-3 targets (dark squares), while the rde-1 mutant (D) did not. (*) As described in Experimental Procedures, the characterized dcr-1(mg375) strain YY011 has recently been shown to carry a background mutation upstream of the mut-16 gene; while this mutation does not account for the ~100 fold effect on numerous RRF-3 target RNAs, we cannot rule out a contribution of background to the observed effects (see Experimental Procedures). See also Figure S3.
Figure 4
Figure 4. Inverse association between siRNA and mRNA levels for RRF-3 target genes
The scatter plot depicts gene-by-gene mRNA tag counts from RNA-seq libraries derived from N2 and rrf-3(pk1426). Genes with mRNA tag counts of zero were assigned a value of 0.5 to avoid exclusion from the plot (axes are in logarithmic scale). Dark squares correspond to the 23 exemplary RRF-3 target genes. Lighter dots correspond to the rest of the 21133 genes in the cDNA reference dataset. The trendline denotes the expected mRNA fragment alignment counts had the samples been derived from identical populations. The trendline varies from the diagonal due to difference in total read counts between samples. See also Table S2.
Figure 5
Figure 5. RRF-3 is required genome-wide for production of 26-nt, type A siRNAs
Type A RNAs were sequenced using a method that selects for small RNAs with 5′ monophosphates. (A) Histograms of type A siRNA length distributions showing that the antisense-oriented, 26-nt peak is absent in rrf-3, dcr-1, eri-1, eri-9, and ergo-1 mutant strains but not rrf-1. After aligning to the reference cDNA set, reads were separated based on alignment orientation, and the frequency of each length between 19 and 28 nt tabulated for both antisense (left) and sense (right). Sense-oriented alignments served as an internal control to show that all lengths were represented in each sample. (B) Stacked bar charts indicate a decreased number of genes produced 26-nt, antisense, type A siRNAs in the rrf-3 mutant sample relative to N2. Genes were categorized according to siRNA counts, and the percent of genes in each category is shown on the Y-axis. For both the rrf-3(pk1426) and N2 samples, the set of 23 RRF-3 target genes are shown separately from the set of 21133 genes in the WS190 reference set. For categorization, the siRNA counts were normalized by the number of microRNAs in each library to account for differences in sample sizes. (C) Many genes with large numbers of 26-nt type A siRNAs (dependent upon RRF-3) can produce type B siRNAs independently of RRF-3. In the scatter plot, each gene is represented by a dot where the X-coordinate indicates the antisense, 26-nt, type A siRNA count, and the Y-coordinate indicates the fold change in type B siRNA counts between N2 and rrf-3(pk1426). Because the type A siRNA analysis included only siRNAs of the predominant length (26-nt) and orientation (antisense), the type B siRNAs were processed in a parallel fashion: only siRNAs of 22-nt length and antisense orientation were included. Also for the type B siRNAs, each gene s alignment count was increased by 1 to prevent division by zero. To avoid outliers arising from ratios of small numbers, genes with type B siRNA counts of less than 50 from the N2 sample were excluded from the analysis. The 14 RRF-3 targets that met this criterion are represented by the red squares, and the rest of the 1164 genes are represented by green dots. For the type A siRNAs, genes with alignment counts of zero were assigned a value of 0.5 to avoid exclusion from the plot s logarithmic-scaled axis. See also Figure S4.
Figure 6
Figure 6. A model of the somatic ERI pathway
All factors implicated by our data in the somatic ERI pathway are included in the model. The dashed line through the center represents a conceptual division between the primary and secondary phases of the pathway; our data do not exclude more complicated feedback mechanisms in either direction. The Argonautes labeled with a “?” are included to indicate that NRDE-3 may be one of multiple Argonautes with a substantial role in the secondary phase. The NIHMS has received the file ‘mmc1.pdf’ as supplementary data. The file will not appear in this PDF Receipt, but it will be linked to the web version of your manuscript.

Comment in

References

    1. Ambros V, Lee RC, Lavanway A, Williams PT, Jewell D. MicroRNAs and other tiny endogenous RNAs in C. elegans. Curr Biol. 2003;13:807–818. - PubMed
    1. Aoki K, Moriguchi H, Yoshioka T, Okawa K, Tabara H. In vitro analyses of the production and activity of secondary small interfering RNAs in C. elegans. Embo J. 2007;26:5007–5019. - PMC - PubMed
    1. Asikainen S, Storvik M, Lakso M, Wong G. Whole genome microarray analysis of C. elegans rrf-3 and eri-1 mutants. FEBS Lett. 2007;581:5050–5054. - PubMed
    1. Axtell MJ, Jan C, Rajagopalan R, Bartel DP. A two-hit trigger for siRNA biogenesis in plants. Cell. 2006;127:565–577. - PubMed
    1. Barton MK, Schedl TB, Kimble J. Gain-of-function mutations of fem-3, a sex-determination gene in Caenorhabditis elegans. Genetics. 1987;115:107–119. - PMC - PubMed

Publication types

MeSH terms