

CoMFA analysis of tgDHFR and rlDHFR based on antifolates with 6-5 fused ring system using the all-orientation search (AOS) routine and a modified cross-validated r(2)-guided region selection (q(2)-GRS) routine and its initial application
- PMID: 20117005
- PMCID: PMC2845980
- DOI: 10.1016/j.bmc.2009.12.066
CoMFA analysis of tgDHFR and rlDHFR based on antifolates with 6-5 fused ring system using the all-orientation search (AOS) routine and a modified cross-validated r(2)-guided region selection (q(2)-GRS) routine and its initial application
Abstract
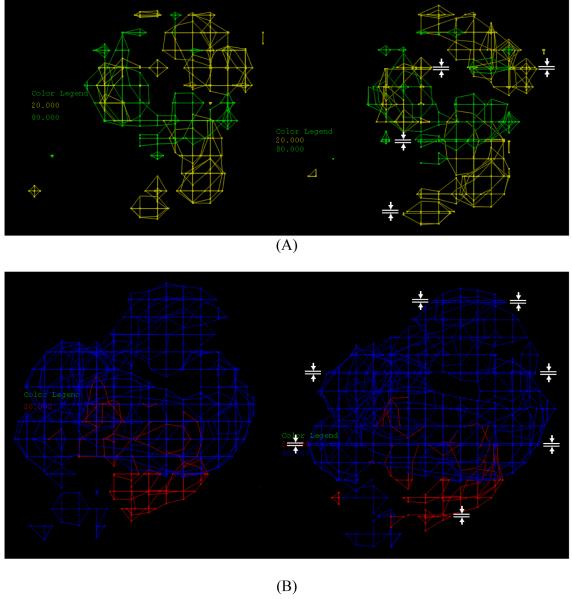
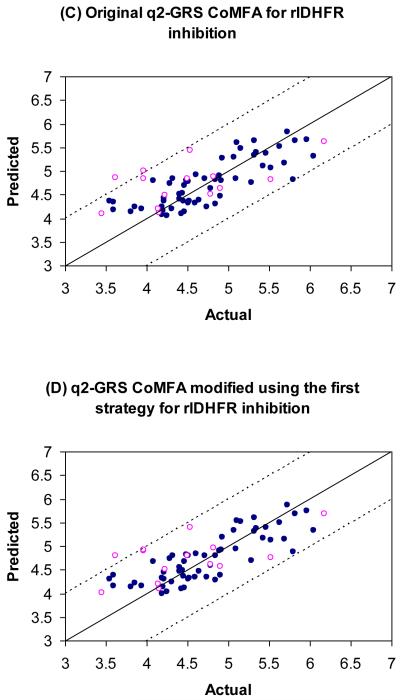
We report the development of CoMFA analysis models that correlate the 3D chemical structures of 80 compounds with 6-5 fused ring system synthesized in our laboratory and their inhibitory potencies against tgDHFR and rlDHFR. In addition to conventional CoMFA analysis, we used two routines available in the literature aimed at the optimization of CoMFA: all-orientation search (AOS) and cross-validated r(2)-guided region selection (q(2)-GRS) to further optimize the models. During this process, we identified a problem associated with q(2)-GRS routine and modified using two strategies. Thus, for the inhibitory activity against each enzyme (tgDHFR and rlDHFR), five CoMFA models were developed using the conventional CoMFA, AOS optimized CoMFA, the original q(2)-GRS optimized CoMFA and the modified q(2)-GRS optimized CoMFA using the first and the second strategy. In this study, we demonstrate that the modified q(2)-GRS routines are superior to the original routine. On the basis of the steric contour maps of the models, we designed four new compounds in the 2,4-diamino-5-methyl-6-phenylsulfanyl-substituted pyrrolo[2,3-d]pyrimidine series. As predicted, the new compounds were potent and selective inhibitors of tgDHFR. One of them, 2,4-diamino-5-methyl-6-(2',6'-dimethylphenylthio)pyrrolo[2,3-d]pyrimidine, is the first 6-5 fused ring system compound with nanomolar tgDHFR inhibitory activity. The HCl salt of this compound was also prepared to increase solubility. Both forms of the drug were tested in vivo in a Toxoplasma gondii infection mouse model. The results indicate that both forms were active with the HCl salt significantly more potent than the free base.
Copyright 2010 Elsevier Ltd. All rights reserved.
Figures


Similar articles
-
2,4-diamino-5-deaza-6-substituted pyrido[2,3-d]pyrimidine antifolates as potent and selective nonclassical inhibitors of dihydrofolate reductases.J Med Chem. 1996 Mar 29;39(7):1438-46. doi: 10.1021/jm950786p. J Med Chem. 1996. PMID: 8691474
-
Synthesis and biological evaluation of 2,4-diamino-6-(arylaminomethyl)pyrido[2,3-d]pyrimidines as inhibitors of Pneumocystis carinii and Toxoplasma gondii dihydrofolate reductase and as antiopportunistic infection and antitumor agents.J Med Chem. 2003 Nov 6;46(23):5074-82. doi: 10.1021/jm030312n. J Med Chem. 2003. PMID: 14584957
-
Effect of N9-methylation and bridge atom variation on the activity of 5-substituted 2,4-diaminopyrrolo[2,3-d]pyrimidines against dihydrofolate reductases from Pneumocystis carinii and Toxoplasma gondii.J Med Chem. 1997 Mar 28;40(7):1173-7. doi: 10.1021/jm960717q. J Med Chem. 1997. PMID: 9089339
-
CoMFA and CoMSIA analyses of Pneumocystis carinii dihydrofolate reductase, Toxoplasma gondii dihydrofolate reductase, and rat liver dihydrofolate reductase.J Med Chem. 2005 Mar 10;48(5):1448-69. doi: 10.1021/jm040153n. J Med Chem. 2005. PMID: 15743188
-
A review of molecular modelling studies of dihydrofolate reductase inhibitors against opportunistic microorganisms and comprehensive evaluation of new models.Curr Pharm Des. 2011;17(7):712-51. doi: 10.2174/138161211795428966. Curr Pharm Des. 2011. PMID: 21395543 Review.
Cited by
-
Review of Experimental Compounds Demonstrating Anti-Toxoplasma Activity.Antimicrob Agents Chemother. 2016 Nov 21;60(12):7017-7034. doi: 10.1128/AAC.01176-16. Print 2016 Dec. Antimicrob Agents Chemother. 2016. PMID: 27600037 Free PMC article. Review.
References
-
- Klepser ME, Klepser TB. Drugs. 1997;53:40–73. - PubMed
-
- Gangjee A, Devraj R, McGuire JJ, Kisliuk RL, Queener SF, Barrows LR. J. Med. Chem. 1994;34:1169–1176. - PubMed
-
- Gangjee A, Mavandadi F, Queener SF, McGuire JJ. J. Med. Chem. 1995;38:2158–2165. - PubMed
-
- Gangjee A, Mavandadi F, Kisliuk RL, McGuire JJ, Queener SF. J. Med. Chem. 1996;39:4563–4568. - PubMed
-
- Gangjee A, Mavandadi F, Queener SF. J. Med. Chem. 1997;40:1173–1177. - PubMed
Publication types
MeSH terms
Substances
Grants and funding
LinkOut - more resources
Full Text Sources
Chemical Information
Research Materials
