. 2010 May;138(5):1997-2005.
doi: 10.1053/j.gastro.2010.01.044. Epub 2010 Feb 1.

Cholecystokinin knockout mice are resistant to high-fat diet-induced obesity

Affiliations

Cholecystokinin knockout mice are resistant to high-fat diet-induced obesity

Chun-Min Lo et al. Gastroenterology. 2010 May.

Abstract

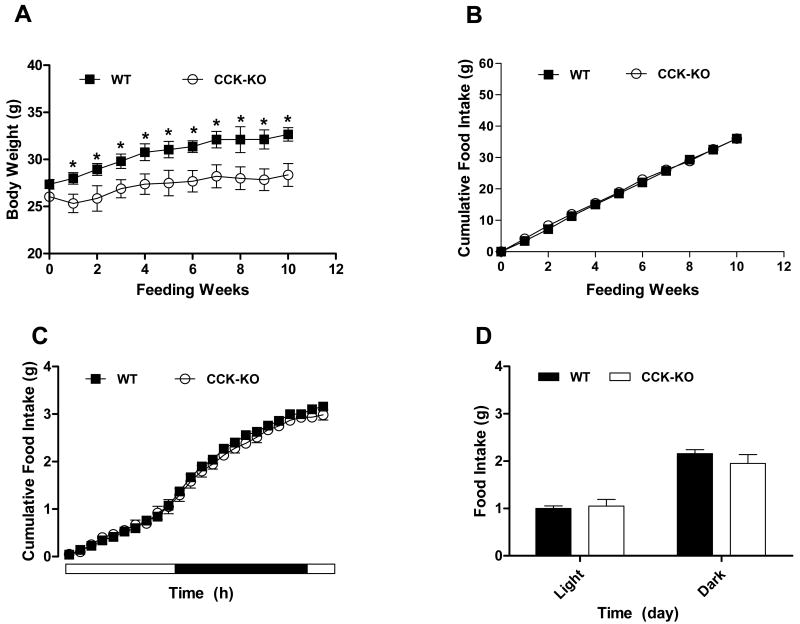
Background & aims: Cholecystokinin (CCK) is a satiation peptide released during meals in response to lipid intake; it regulates pancreatic digestive enzymes that are required for absorption of nutrients. We proposed that mice with a disruption in the CCK gene (CCK knockout [CCK-KO] mice) that were fed a diet of 20% butter fat would have altered fat metabolism.

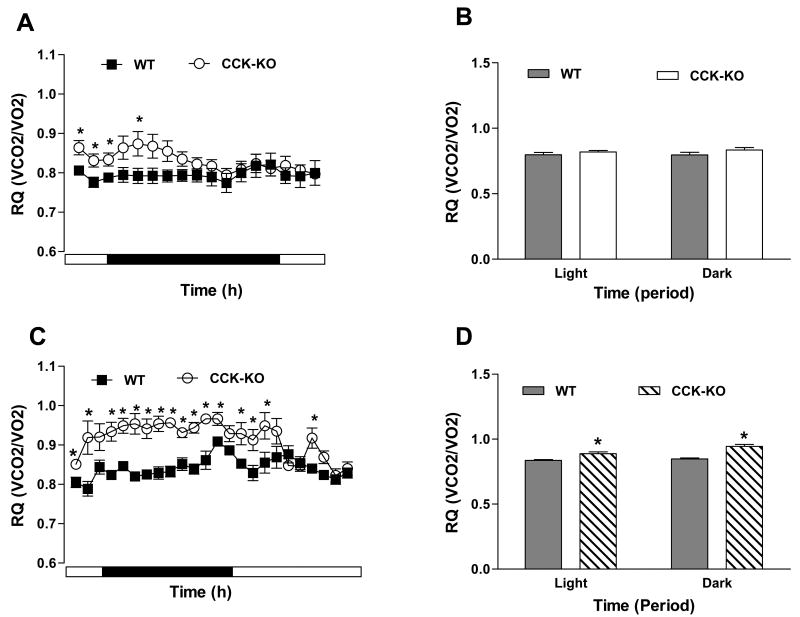
Methods: We used quantitative magnetic resonance imaging to determine body composition and monitored food intake of CCK-KO mice using an automated measurement system. Intestinal fat absorption and energy expenditure were determined using a noninvasive assessment of intestinal fat absorption and an open circuit calorimeter, respectively.

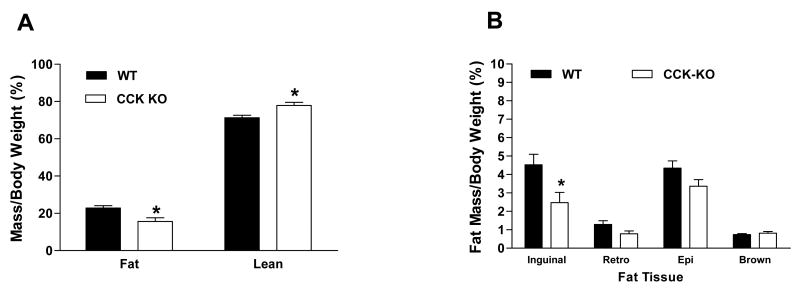
Results: After consuming a high-fat diet for 10 weeks, CCK-KO mice had reduced body weight gain and body fat mass and enlarged adipocytes, despite the same level of food intake as wild-type mice. CCK-KO mice also had defects in fat absorption, especially of long-chain saturated fatty acids, but pancreatic triglyceride lipase did not appear to have a role in the fat malabsorption. Energy expenditure was higher in CCK-KO than wild-type mice, and CCK-KO mice had greater oxidation of carbohydrates while on the high-fat diet. Plasma leptin levels in the CCK-KO mice fed the high-fat diet were markedly lower than in wild-type mice, although levels of insulin, gastric-inhibitory polypeptide, and glucagon-like peptide-1 were normal.

Conclusions: CCK is involved in regulating the metabolic rate and is important for lipid absorption and control of body weight in mice placed on a high-fat diet.


Conflict of interest statement

No conflicts of interest exist for any of the authors listed above.

Figures

Figure 1
Figure 1
Mean body weight and food intake. (A) Mean body weight, and (B) food intake of CCK-KO and WT (n=8 per group) mice. (C) Cumulative food Intake, and (D) food intake during light and dark cycle feeding of CCK-KO and WT (n=6 per group) mice. During the food intake study, experimental mice were permitted free access to powdered high fat diet and food intake was recorded for each animal on day 4. Data are expressed as mean ± SEM and values with asterisks represent significant differences relative to age-matched WT mice (P < 0.05).
Figure 2
Figure 2
Body composition of CCK-KO and WT mice. (A) Fat and lean mass of CCK-KO and WT (n=8 per group) mice were determined following a 10-week HFD. (B) Percentage of various fat tissues per body weight were collected after 5-h fasting at the end of 10-weeks HFD. (C) Distribution of fat cell size (in %) in inguinal fat tissue. (D) Morphology of inguinal fat adipocytes in WT and CCK-KO mice determined by H&E staining. (E-F) Distribution of fat cell size (in %) in retroperitoneal and epididymal fat tissue. Data are expressed as mean ± SEM and values with asterisks represent significant differences relative to the control group (P < 0.05).
Figure 2
Figure 2
Body composition of CCK-KO and WT mice. (A) Fat and lean mass of CCK-KO and WT (n=8 per group) mice were determined following a 10-week HFD. (B) Percentage of various fat tissues per body weight were collected after 5-h fasting at the end of 10-weeks HFD. (C) Distribution of fat cell size (in %) in inguinal fat tissue. (D) Morphology of inguinal fat adipocytes in WT and CCK-KO mice determined by H&E staining. (E-F) Distribution of fat cell size (in %) in retroperitoneal and epididymal fat tissue. Data are expressed as mean ± SEM and values with asterisks represent significant differences relative to the control group (P < 0.05).
Figure 3
Figure 3
Locomotor activity in CCK-KO and WT mice. CCK-KO and WT mice (n=4 per group), 27-29 weeks of age, were individually housed in home cages which were then placed in a SmartFrame system for 4 continuous days. Values represent mean ± SEM.
Figure 4
Figure 4
Fat absorption and pancreatic PTL activity in CCK-KO and WT mice. (A) Total fat absorption and (B) fatty acid profiles in fecal pellets were determined using gas chromatography. Fecal pellets were collected on the 4th day after animals started to receive a 20% fat diet mixture with 5% Olestra and again during the 9th week on the HFD. (C) Total pancreatic protein was analyzed for PTL activity. Data are expressed as mean ± SEM for 7 animals per group and values with asterisks represent significant differences relative to the WT mice (P < 0.05).
Figure 5
Figure 5
Energy expenditure in CCK-KO and WT mice. (A) Hourly energy expenditure and (B) total energy expenditure during dark and light cycles during an 18-h fasting period. (C) Hourly energy expenditure and (D) total energy expenditure during dark and light cycles during a 24-h feeding period. Data are expressed as mean ± SEM and values with asterisks represent significant differences compared to the control group (P < 0.05).
Figure 6
Figure 6
RQ value in CCK-KO and WT mice. (A) Hourly metabolic data (O2 consumption and CO2 production) and (B) RQ value during dark and light cycles during an 18-h fasting period. (C) Hourly metabolic rate and (D) RQ during dark and light cycles during a 24-h feeding period. RQ value was acquired in CCK-KO and WT mice during fasting and feeding. Data are expressed as mean ± SEM and values with asterisks represent significant differences relative to the WT mice (P < 0.05).

Similar articles

Cited by

References

    1. Woods SC, Seeley RJ, Rushing PA, D'Alessio D, Tso P. A controlled high-fat diet induces an obese syndrome in rats. J Nutr. 2003;133:1081–1087. - PubMed
    1. Woods SC, D'Alessio DA. Central control of body weight and appetite. J Clin Endocrinol Metab. 2008;93:S37–S50. - PMC - PubMed
    1. Walsh JH. Gastrointesinal hormones. In: Johnson LR, Christensen J, Jackson MJ, Jacobson ED, Walsh JH, editors. Physiology of the gastrointesinal tract. second. New York: Raven Press; 1986. pp. 181–253.
    1. Muller K, Hsiao S. Specificity of cholecystokinin satiety effect: reduction of food but not water itnake. Pharmacol Biochem Behav. 1977;6:643–646. - PubMed
    1. Kraly FS, Carty WJ, Resnick S, Smith GP. Effect of cholecystokinin on meal size and intermeal interval in the sham-feeding rat. J Comp Physiol Psychol. 1978;92:697–707. - PubMed

Publication types

MeSH terms