Review
. 2010 Jun;51(2):206-13.
doi: 10.1016/j.ymeth.2010.01.017. Epub 2010 Jan 29.

Live-cell analysis of kinetochore-microtubule interaction in budding yeast

Affiliations
Review

Live-cell analysis of kinetochore-microtubule interaction in budding yeast

Kozo Tanaka et al. Methods. 2010 Jun.

Abstract

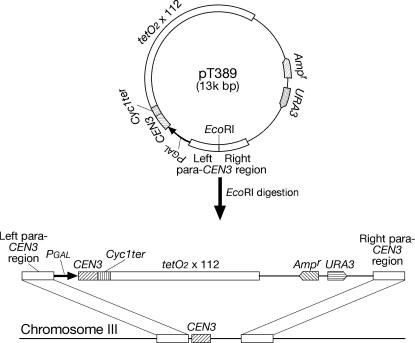
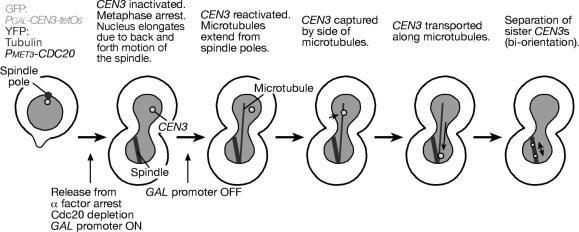
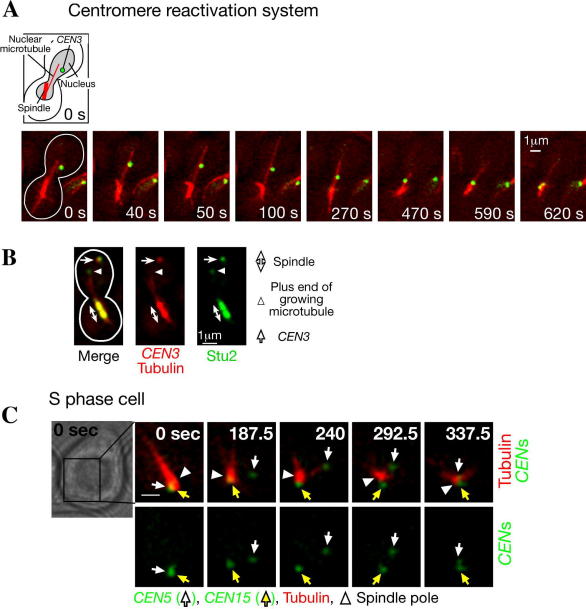
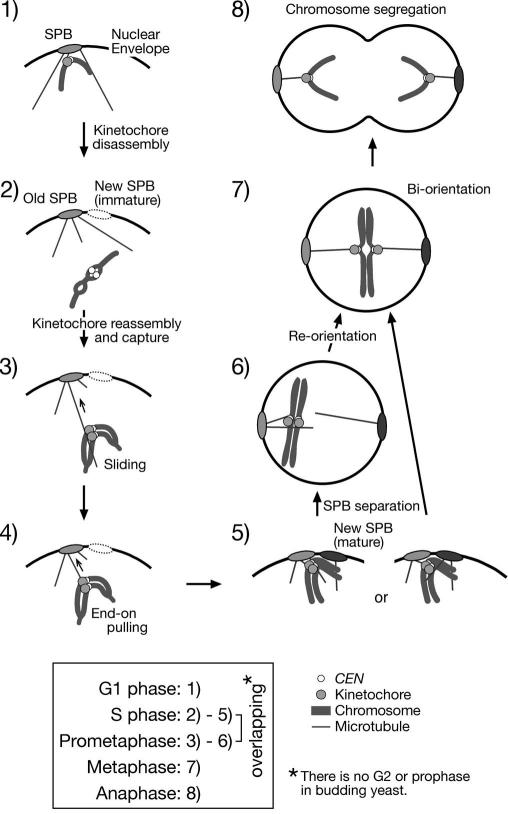
Kinetochore capture and transport by spindle microtubules plays a crucial role in high-fidelity chromosome segregation, although its detailed mechanism has remained elusive. It has been difficult to observe individual kinetochore-microtubule interactions because multiple kinetochores are captured by microtubules during a short period within a small space. We have developed a method to visualize individual kinetochore-microtubule interactions in Saccharomyces cerevisiae, by isolating one of the kinetochores from others through regulation of the activity of a centromere. We detail this technique, which we call 'centromere reactivation system', for dissection of the process of kinetochore capture and transport on mitotic spindle. Kinetochores are initially captured by the side of microtubules extending from a spindle pole, and subsequently transported poleward along them, which is an evolutionarily conserved process from yeast to vertebrate cells. Our system, in combination with amenable yeast genetics, has proved useful to elucidate the molecular mechanisms of kinetochore-microtubule interactions. We discuss practical considerations for applying our system to live cell imaging using fluorescence microscopy.


Figures

Fig. 1
Fig. 1
Replacement of CEN3 with the Pgal-CEN3 construct for the centromere reactivation system. The linearized plasmid pT389 (see Section 2.1.1) was integrated into the CEN3 locus through recombination at para-CEN3 regions. CEN3, para-CEN3 regions, GAL1-10 promoter, CYC1 transcription terminator, an array of tetOs, ampicillin-resistant gene, and URA3 gene are indicated.
Fig. 2
Fig. 2
Diagrams of the experimental system for observing kinetochore capture by microtubules (centromere reactivation system) and the process of kinetochore capture and transport. See Sections 2, 3 for details.
Fig. 3
Fig. 3
Making agarose pads on microscope slides. See Section 2.3.1 for details.
Fig. 4
Fig. 4
Examples of live cell imaging. (A) Visualizing kinetochore capture by microtubules in the centromere reactivation system. Pmet3-CDC20 Pgal-CEN3-tetOs TetR-GFP YFP-TUB1 cells (T3531) were treated and observed as described in Section 2. Zero time is set arbitrarily for the first panel, in which the cell shape is outlined. Scale bar, 1 μm. (B) Localization of Stu2 on kinetochores and microtubules, visualized using the centromere reactivation system. STU2-3GFP Pmet3-CDC20 Pgal-CEN3-tetOs TetR-3CFP CFP-TUB1 cells (T3680) were treated as in (A), except that CFP (CEN3 and tubulin) and GFP (Stu2) signals were collected separately. CFP and GFP signals are shown in red and green, respectively. Scale bar, 1 μm. (C) Visualizing kinetochore detachment from microtubules, recapture, and poleward transport in a normal cell cycle . CEN5-tetOs TetR-3CFP CEN15-lacOs GFP-LacI YFP-TUB1 cells (T4243) were treated with α-factor and subsequently released to fresh medium. After 30 min, CFP/GFP and YFP images were collected every 7.5 s for 8 min. CEN5 and CEN15 are shown in green, and microtubules are shown in red. White arrows, yellow arrows and white arrowheads indicate CEN5, CEN15 and a spindle pole, respectively. 0 s in the montage; start of image acquisition. Scale bar; 1 μm.
Fig. 5
Fig. 5
Overview of kinetochore–microtubule interactions during the cell cycle in budding yeast. Only a part of the nuclear envelope is shown in (1)–(5), while the whole is depicted in (6)–(8). See Section 4.2 for details.

Similar articles

Cited by

References

    1. McIntosh J.R., Grishchuk E.L., West R.R. Annu. Rev. Cell Dev. Biol. 2002;181:193–219. - PubMed
    1. Hayden J.H., Bowser S.S., Rieder C.L. J. Cell Biol. 1990;1111:1039–1045. - PMC - PubMed
    1. Merdes A., De Mey J. Eur. J. Cell Biol. 1990;531:313–325. - PubMed
    1. Rieder C.L., Alexander S.P. J. Cell Biol. 1990;1101:81–95. - PMC - PubMed
    1. Michaelis C., Ciosk R., Nasmyth K. Cell. 1997;911:35–45. - PubMed

Publication types

MeSH terms

LinkOut - more resources