

The relationship between curvature, flexibility and persistence length in the tropomyosin coiled-coil
- PMID: 20117217
- PMCID: PMC2856770
- DOI: 10.1016/j.jsb.2010.01.016
The relationship between curvature, flexibility and persistence length in the tropomyosin coiled-coil
Abstract
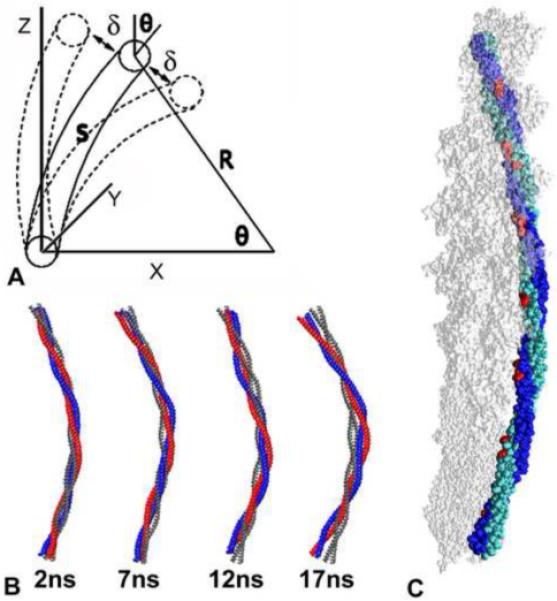
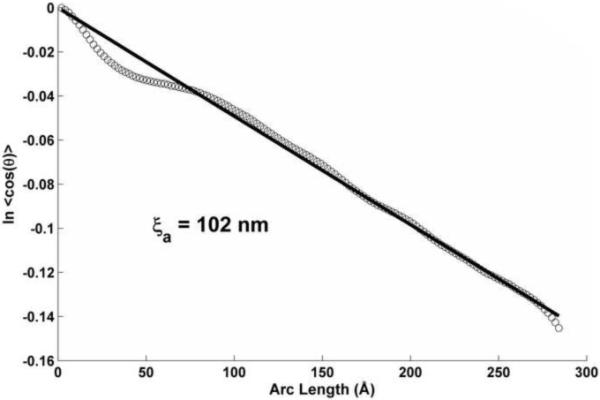
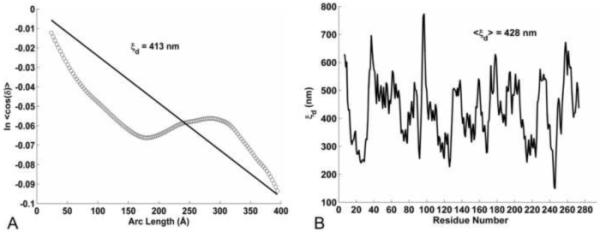
The inherent flexibility of rod-like tropomyosin coiled-coils is a significant factor that constrains tropomyosin's complex positional dynamics on actin filaments. Flexibility of elongated straight molecules typically is assessed by persistence length, a measure of lengthwise thermal bending fluctuations. However, if a molecule's equilibrium conformation is curved, this formulation yields an "apparent" persistence length ( approximately 100nm for tropomyosin), measuring deviations from idealized straight conformations which then overestimate actual dynamic flexibility. To obtain the "dynamic" persistence length, a true measurement of flexural stiffness, the average curvature of the molecule must be taken into account. Different methods used in our studies for measuring the dynamic persistence length directly from Molecular Dynamics (MD) simulations of tropomyosin are described here in detail. The dynamic persistence length found, 460+/-40nm, is approximately 12-times longer than tropomyosin and 5-times the apparent persistence length, showing that tropomyosin is considerably stiffer than previously thought. The longitudinal twisting behavior of tropomyosin during MD shows that the amplitude of end-to-end twisting fluctuation is approximately 30 degrees when tropomyosin adopts its near-average conformation. The measured bending and twisting flexibilities are used to evaluate different models of tropomyosin motion on F-actin.
Copyright 2010 Elsevier Inc. All rights reserved.
Figures
Similar articles
-
The structural dynamics of α-tropomyosin on F-actin shape the overlap complex between adjacent tropomyosin molecules.Arch Biochem Biophys. 2014 Jun 15;552-553:68-73. doi: 10.1016/j.abb.2013.09.011. Epub 2013 Sep 23. Arch Biochem Biophys. 2014. PMID: 24071513 Free PMC article.
-
The shape and flexibility of tropomyosin coiled coils: implications for actin filament assembly and regulation.J Mol Biol. 2010 Jan 15;395(2):327-39. doi: 10.1016/j.jmb.2009.10.060. Epub 2009 Oct 31. J Mol Biol. 2010. PMID: 19883661
-
Precise Binding of Tropomyosin on Actin Involves Sequence-Dependent Variance in Coiled-Coil Twisting.Biophys J. 2018 Sep 18;115(6):1082-1092. doi: 10.1016/j.bpj.2018.08.017. Epub 2018 Aug 18. Biophys J. 2018. PMID: 30195938 Free PMC article.
-
Tropomyosin: function follows structure.Adv Exp Med Biol. 2008;644:60-72. doi: 10.1007/978-0-387-85766-4_5. Adv Exp Med Biol. 2008. PMID: 19209813 Review.
-
A new twist on tropomyosin binding to actin filaments: perspectives on thin filament function, assembly and biomechanics.J Muscle Res Cell Motil. 2020 Mar;41(1):23-38. doi: 10.1007/s10974-019-09501-5. Epub 2019 Feb 15. J Muscle Res Cell Motil. 2020. PMID: 30771202 Free PMC article. Review.
Cited by
-
Mechanisms of microtubule dynamics and force generation examined with computational modeling and electron cryotomography.Nat Commun. 2020 Jul 28;11(1):3765. doi: 10.1038/s41467-020-17553-2. Nat Commun. 2020. PMID: 32724196 Free PMC article.
-
Molecular Mechanisms of the Deregulation of Muscle Contraction Induced by the R90P Mutation in Tpm3.12 and the Weakening of This Effect by BDM and W7.Int J Mol Sci. 2021 Jun 12;22(12):6318. doi: 10.3390/ijms22126318. Int J Mol Sci. 2021. PMID: 34204776 Free PMC article.
-
Nebulin and titin modulate cross-bridge cycling and length-dependent calcium sensitivity.J Gen Physiol. 2019 May 6;151(5):680-704. doi: 10.1085/jgp.201812165. Epub 2019 Apr 4. J Gen Physiol. 2019. PMID: 30948421 Free PMC article.
-
Tarantula myosin free head regulatory light chain phosphorylation stiffens N-terminal extension, releasing it and blocking its docking back.Mol Biosyst. 2015 Aug;11(8):2180-9. doi: 10.1039/c5mb00163c. Mol Biosyst. 2015. PMID: 26038302 Free PMC article.
-
Looking for Targets to Restore the Contractile Function in Congenital Myopathy Caused by Gln147Pro Tropomyosin.Int J Mol Sci. 2020 Oct 14;21(20):7590. doi: 10.3390/ijms21207590. Int J Mol Sci. 2020. PMID: 33066566 Free PMC article.
References
-
- Bednar J, Furrer P, Katritch V, Stasiak AZ, Dubochet J, Stasiak A. Determination of DNA persistence length by cryo-electron microscopy. Separation of the static and dynamic contributions to the apparent persistence length of DNA. J. Mol. Biol. 1995;254:579–594. - PubMed
-
- Bettini A, Pozzan MR, Valdevit E, Frontali C. Microscopic persistence length of native DNA: its relation to average molecular dimensions. Biopolymers. 1980;19:1689–1694.
-
- Boal DH. Mechanics of the Cell. Cambridge University Press; Cambridge, UK: 2002.
Publication types
MeSH terms
Substances
Grants and funding
LinkOut - more resources
Full Text Sources
