

A high ankle brachial index is associated with greater left ventricular mass MESA (Multi-Ethnic Study of Atherosclerosis)
- PMID: 20117440
- PMCID: PMC2837506
- DOI: 10.1016/j.jacc.2009.11.010
A high ankle brachial index is associated with greater left ventricular mass MESA (Multi-Ethnic Study of Atherosclerosis)
Abstract
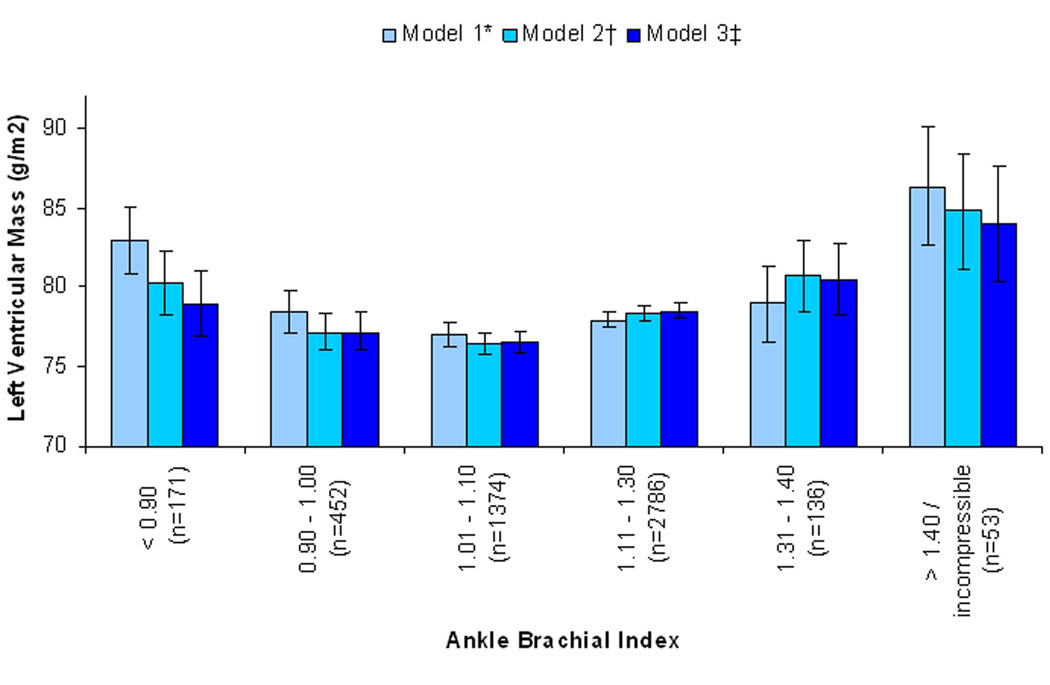
Objectives: This study sought to determine the association of high ankle brachial index (ABI) measurements with left ventricular (LV) mass, and to compare its strength with that of low ABI with LV mass.
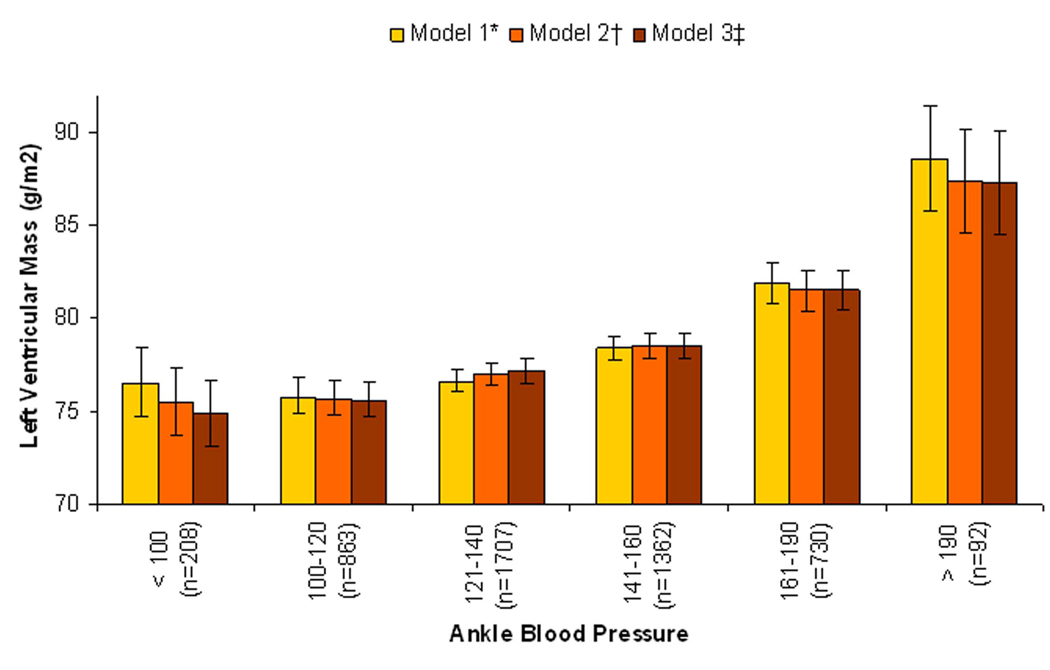
Background: Arterial stiffness leads to LV mass through nonatherosclerotic pathways in mice. In humans, a high ABI indicates stiff peripheral arteries and is associated with cardiovascular disease (CVD) events. Whether high ABI is associated with LV mass in humans and whether this might reflect consequences of arterial stiffness, atherosclerosis, or both is unknown.
Methods: Among 4,972 MESA (Multi-Ethnic Study of Atherosclerosis) participants without clinical CVD, we used linear regression to evaluate the association of low (<0.90) and high (>1.40 or incompressible) ABI with LV mass by cardiac magnetic resonance imaging (MRI). Intermediate ABIs served as the reference category. To determine the effect of subclinical atherosclerosis, models were adjusted for common and internal carotid intima media thickness (cIMT) and natural log-transformed coronary artery calcification.
Results: Compared with subjects with intermediate ABI, LV mass was higher with either low (2.70 g/m(2) higher, 95% confidence interval: 0.65 to 4.75) or high ABI (6.84 g/m(2) higher, 95% confidence interval: 3.2 to 10.47) after adjustment for traditional CVD risk factors, kidney function, and C-reactive protein. However, further adjustment for cIMT and CAC substantially attenuated the association of low ABI with LV mass index (1.24 g/m(2) higher, 95% confidence interval: -0.84 to 3.33), whereas the association of high ABI was minimally altered (6.01 g/m(2) higher, 95% confidence interval: 2.36 to 9.67).
Conclusions: High ABI is associated with greater LV mass; an association that is not attenuated with adjustment for subclinical atherosclerosis in nonperipheral arterial beds. High ABI might lead to greater LV mass through nonatherosclerotic pathways.
Copyright (c) 2010 American College of Cardiology Foundation. Published by Elsevier Inc. All rights reserved.
Figures
Similar articles
-
Non-compressible arterial disease and the risk of coronary calcification in type-2 diabetes.Atherosclerosis. 2013 Sep;230(1):17-22. doi: 10.1016/j.atherosclerosis.2013.06.004. Epub 2013 Jun 28. Atherosclerosis. 2013. PMID: 23958247
-
The ankle-brachial index and incident cardiovascular events in the MESA (Multi-Ethnic Study of Atherosclerosis).J Am Coll Cardiol. 2010 Oct 26;56(18):1506-12. doi: 10.1016/j.jacc.2010.04.060. J Am Coll Cardiol. 2010. PMID: 20951328 Free PMC article.
-
Associations of work hours with carotid intima-media thickness and ankle-brachial index: the Multi-Ethnic Study of Atherosclerosis (MESA).Occup Environ Med. 2012 Oct;69(10):713-20. doi: 10.1136/oemed-2012-100665. Epub 2012 Jul 5. Occup Environ Med. 2012. PMID: 22767870 Free PMC article.
-
Peripheral Artery Disease and Aortic Disease.Glob Heart. 2016 Sep;11(3):313-326. doi: 10.1016/j.gheart.2016.08.005. Glob Heart. 2016. PMID: 27741978 Free PMC article. Review.
-
The role of ankle brachial index and carotid intima-media thickness in vascular risk stratification.Curr Opin Cardiol. 2010 Jul;25(4):394-8. doi: 10.1097/hco.0b013e328338c109. Curr Opin Cardiol. 2010. PMID: 20549844 Review.
Cited by
-
Ankle-brachial index and physical function in older individuals: The Atherosclerosis Risk in Communities (ARIC) study.Atherosclerosis. 2017 Feb;257:208-215. doi: 10.1016/j.atherosclerosis.2016.11.023. Epub 2016 Nov 23. Atherosclerosis. 2017. PMID: 28012644 Free PMC article.
-
Association of diabetes and hemodialysis with ankle pressure and ankle-brachial index in Japanese patients with critical limb ischemia.Diabetes Care. 2012 Oct;35(10):2000-4. doi: 10.2337/dc11-1636. Epub 2012 Jun 20. Diabetes Care. 2012. PMID: 22723344 Free PMC article.
-
Association of fibroblast growth factor-23 with arterial stiffness in the Multi-Ethnic Study of Atherosclerosis.Nephrol Dial Transplant. 2014 Nov;29(11):2099-105. doi: 10.1093/ndt/gfu101. Epub 2014 Apr 29. Nephrol Dial Transplant. 2014. PMID: 24782533 Free PMC article.
-
Left ventricular mass progression despite stable blood pressure and kidney function in stage 3 chronic kidney disease.Am J Nephrol. 2014;39(5):392-9. doi: 10.1159/000362251. Epub 2014 May 6. Am J Nephrol. 2014. PMID: 24818573 Free PMC article.
-
Cardiovascular magnetic resonance in an adult human population: serial observations from the multi-ethnic study of atherosclerosis.J Cardiovasc Magn Reson. 2017 Jul 18;19(1):52. doi: 10.1186/s12968-017-0367-1. J Cardiovasc Magn Reson. 2017. PMID: 28720123 Free PMC article. Review.
References
-
- Quigley FG, Faris IB, Duncan HJ. A comparison of Doppler ankle pressures and skin perfusion pressure in subjects with and without diabetes. Clin Physiol. 1991;11:21–25. - PubMed
-
- Lijmer JG, Hunink MG, van den Dungen JJ, Loonstra J, Smit AJ. ROC analysis of noninvasive tests for peripheral arterial disease. Ultrasound Med Biol. 1996;22:391–398. - PubMed
-
- Orchard TJ, Strandness DE., Jr Assessment of peripheral vascular disease in diabetes. Report and recommendations of an international workshop sponsored by the American Diabetes Association and the American Heart Association September 18–20, 1992 New Orleans, Louisiana. Circulation. 1993;88:819–828. - PubMed
-
- Hirsch AT, Haskal ZJ, Hertzer NR, et al. ACC/AHA 2005 Practice Guidelines for the management of patients with peripheral arterial disease (lower extremity, renal, mesenteric, and abdominal aortic): a collaborative report from the American Association for Vascular Surgery/Society for Vascular Surgery, Society for Cardiovascular Angiography and Interventions, Society for Vascular Medicine and Biology, Society of Interventional Radiology, and the ACC/AHA Task Force on Practice Guidelines (Writing Committee to Develop Guidelines for the Management of Patients With Peripheral Arterial Disease): endorsed by the American Association of Cardiovascular and Pulmonary Rehabilitation; National Heart, Lung, and Blood Institute; Society for Vascular Nursing; TransAtlantic Inter-Society Consensus; and Vascular Disease Foundation. Circulation. 2006;113:e463–e654. - PubMed
-
- Young MJ, Adams JE, Anderson GF, Boulton AJ, Cavanagh PR. Medial arterial calcification in the feet of diabetic patients and matched non-diabetic control subjects. Diabetologia. 1993;36:615–621. - PubMed
Publication types
MeSH terms
Grants and funding
LinkOut - more resources
Full Text Sources
Molecular Biology Databases
Research Materials
