. 2010 Mar;47(6):1181-94.
doi: 10.1016/j.molimm.2010.01.003. Epub 2010 Feb 1.

Identification of the early VIP-regulated transcriptome and its associated, interactome in resting and activated murine CD4 T cells

Affiliations

Identification of the early VIP-regulated transcriptome and its associated, interactome in resting and activated murine CD4 T cells

Sheri Tinnell Dorsam et al. Mol Immunol. 2010 Mar.

Abstract

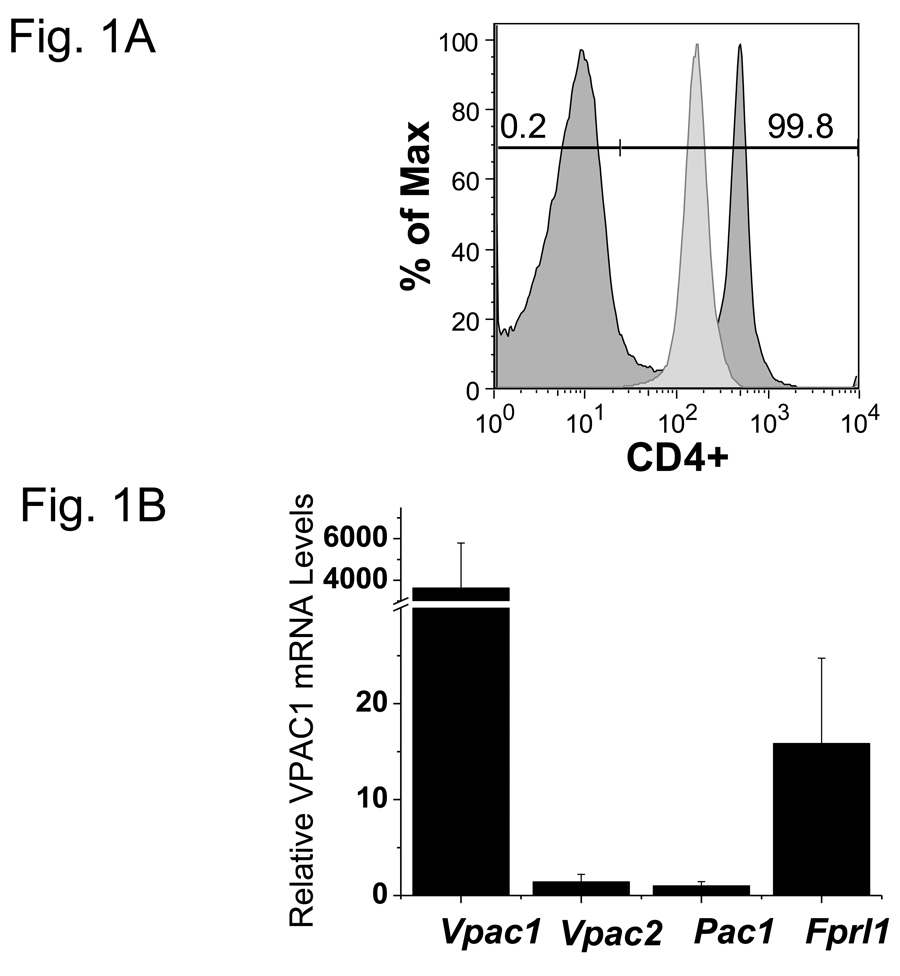
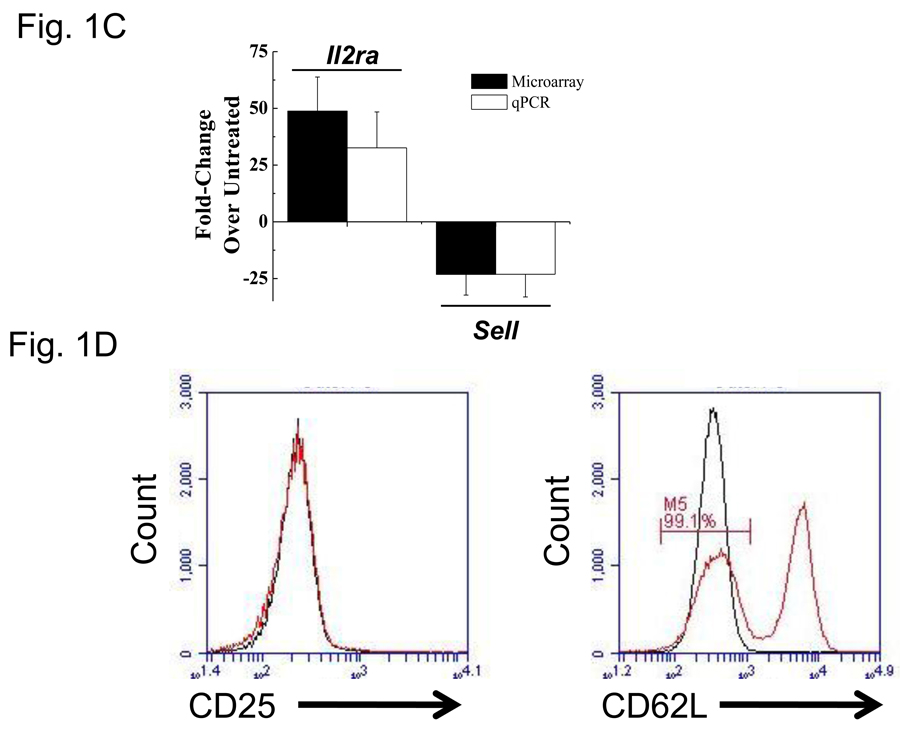
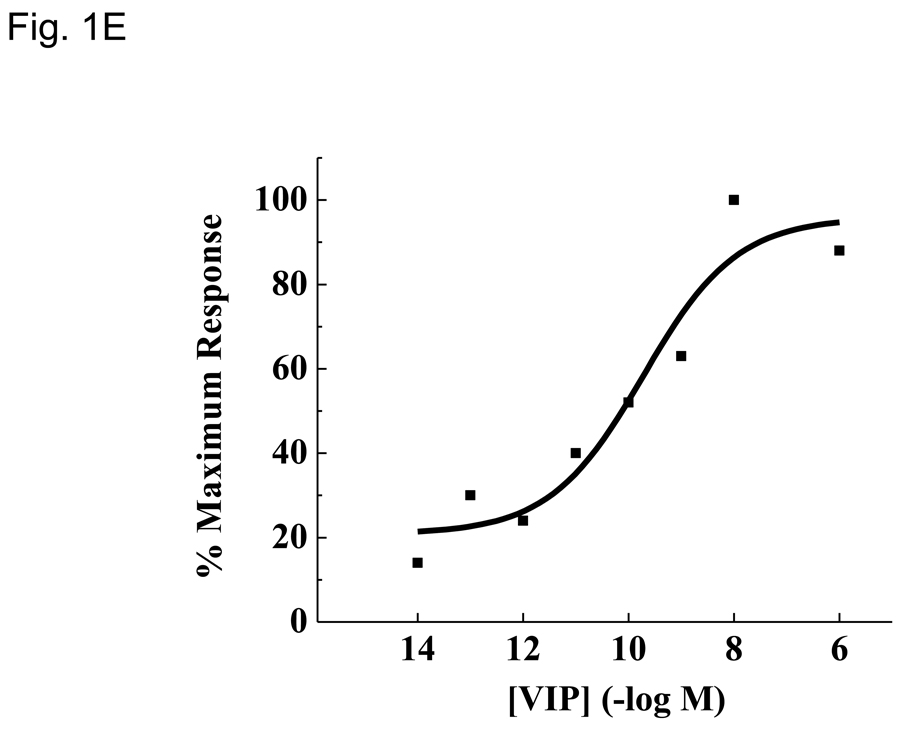
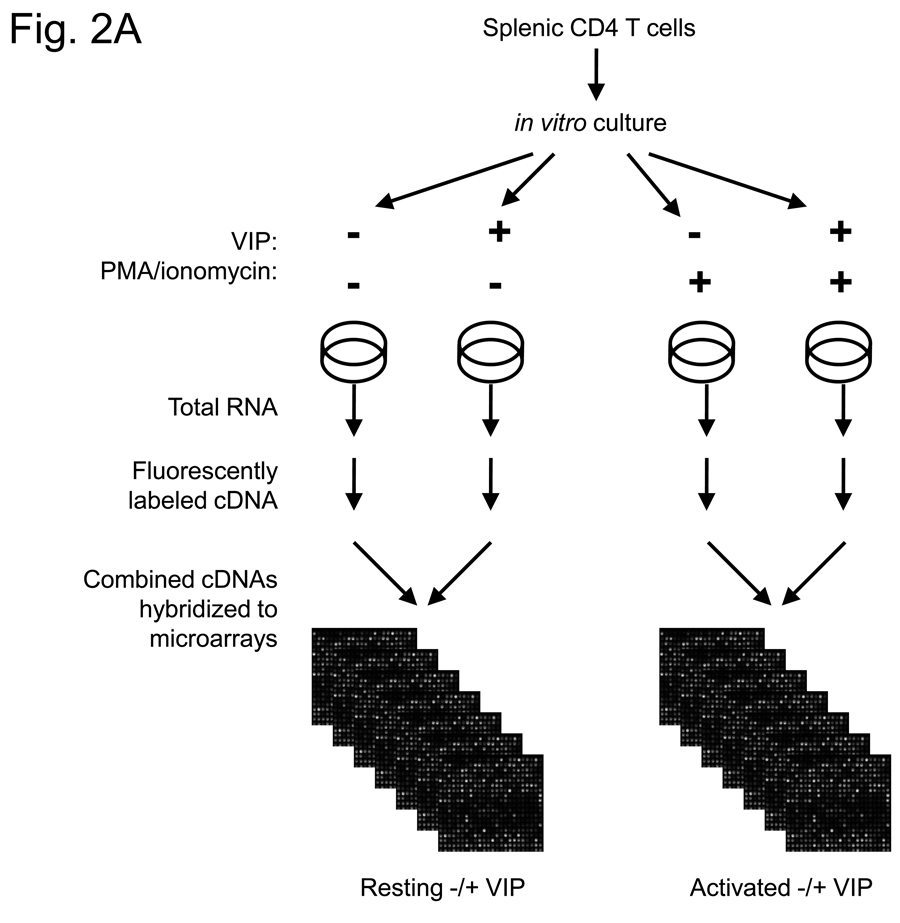
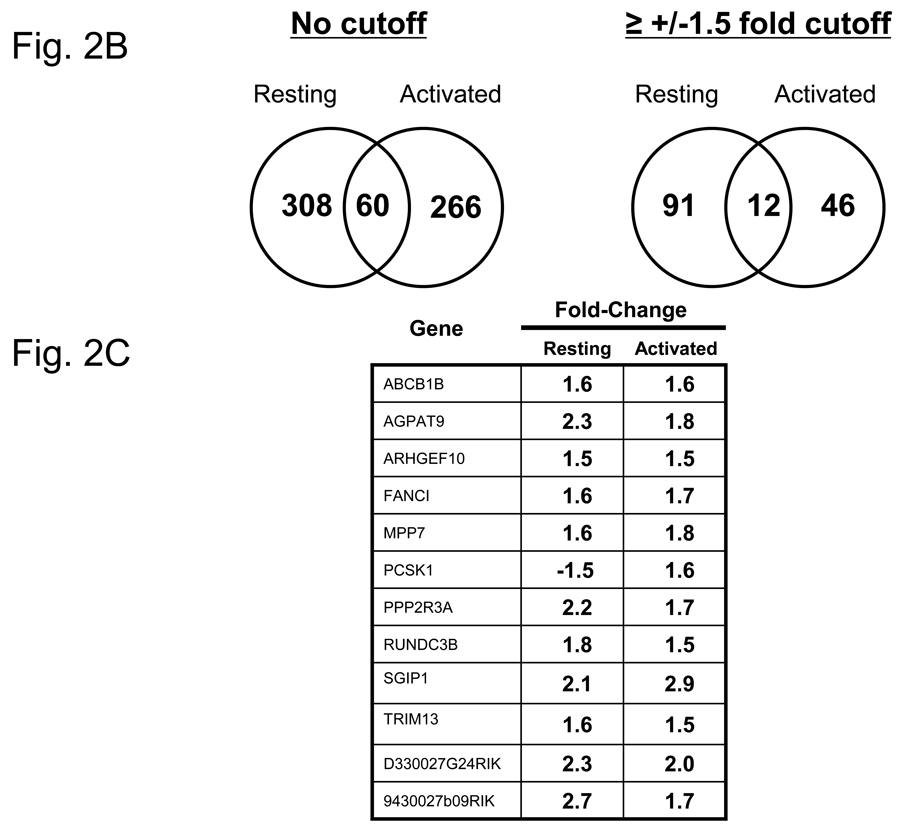
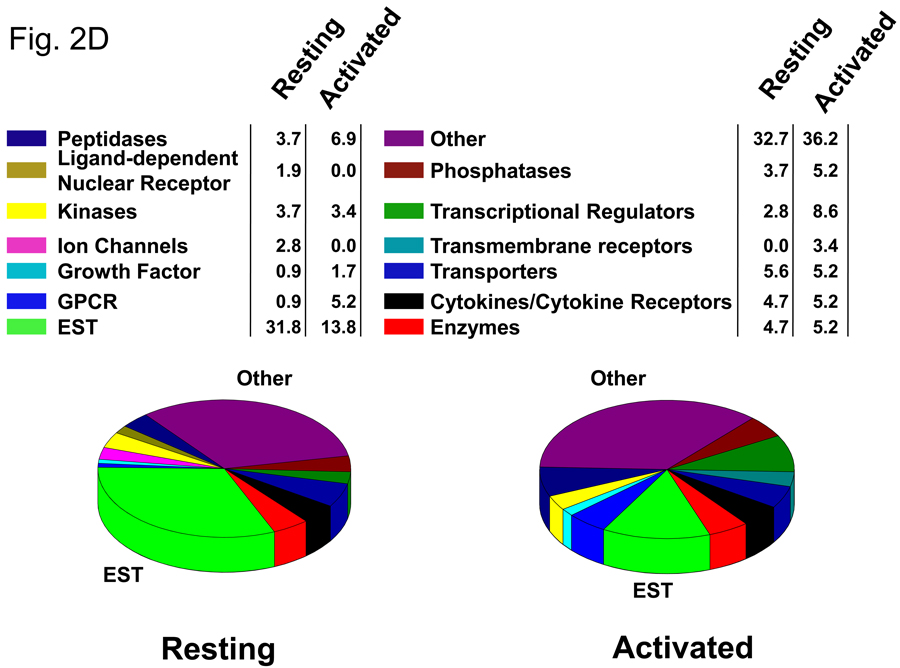
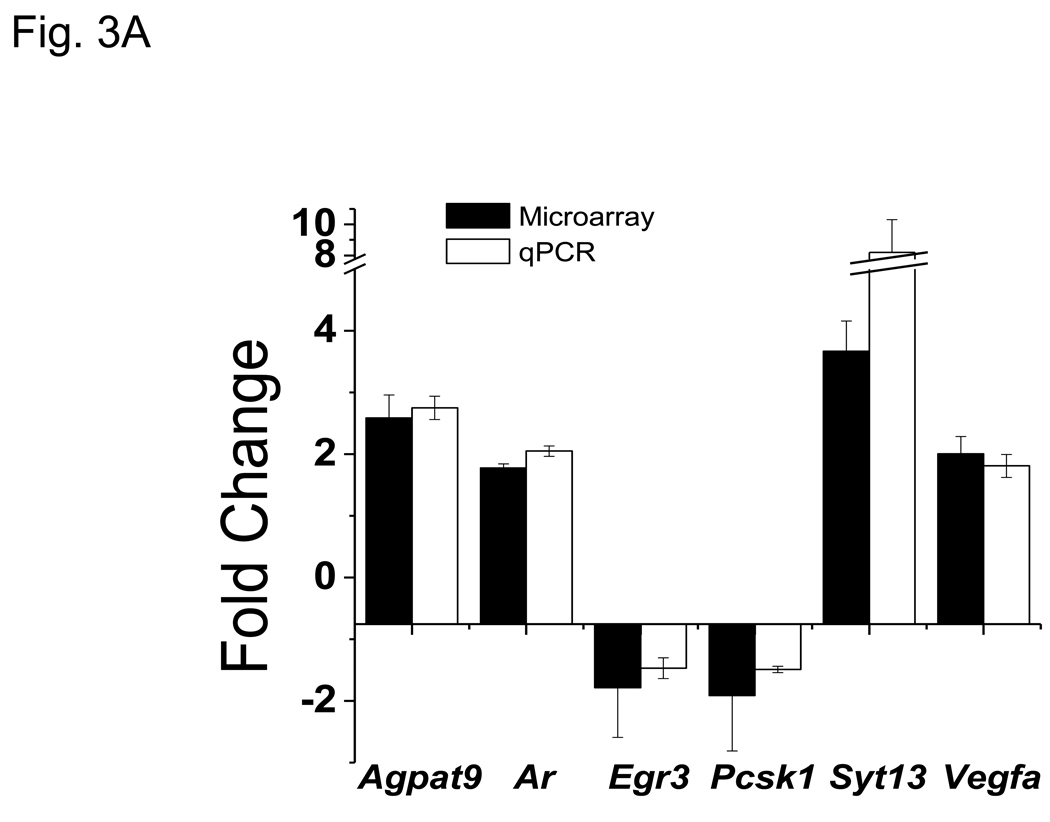
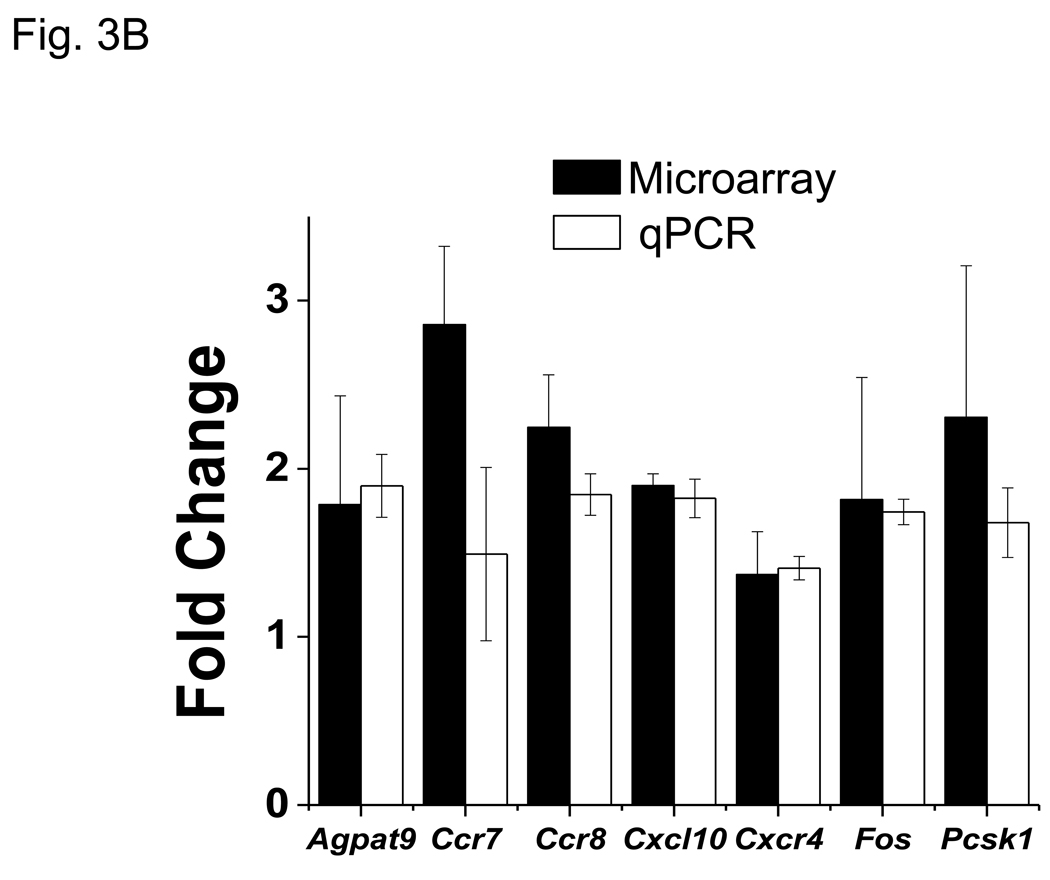
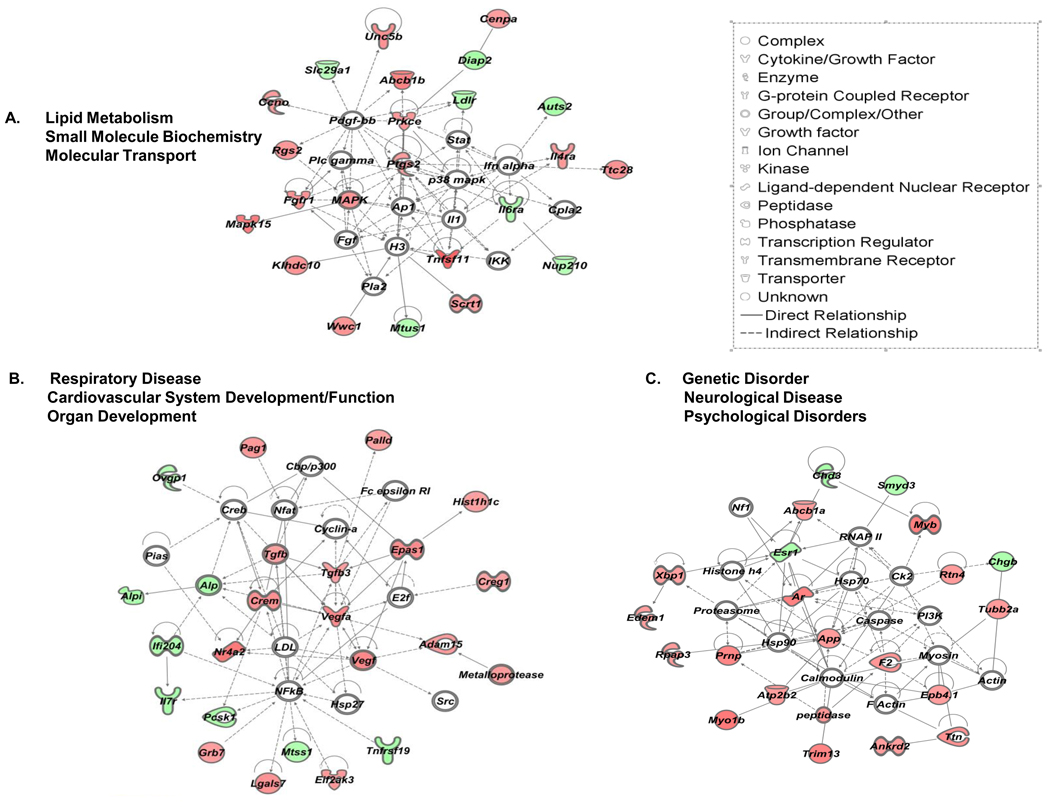
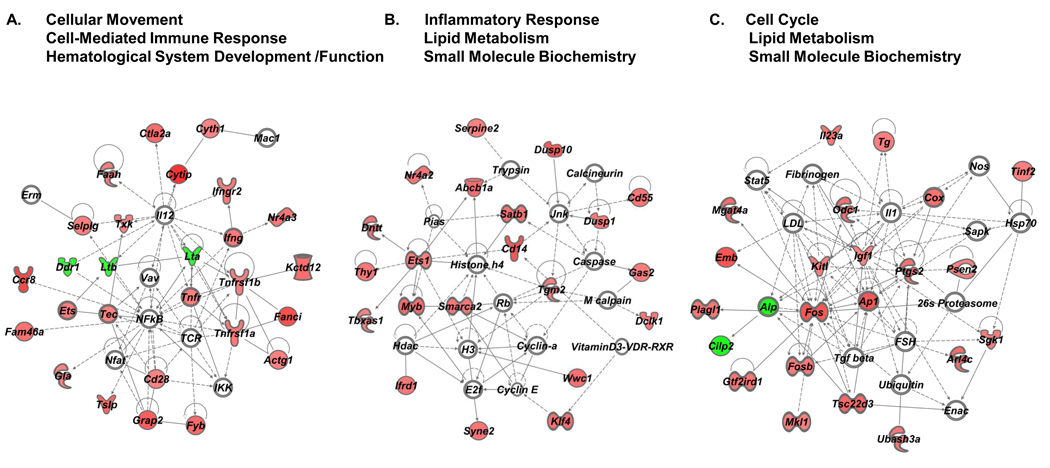
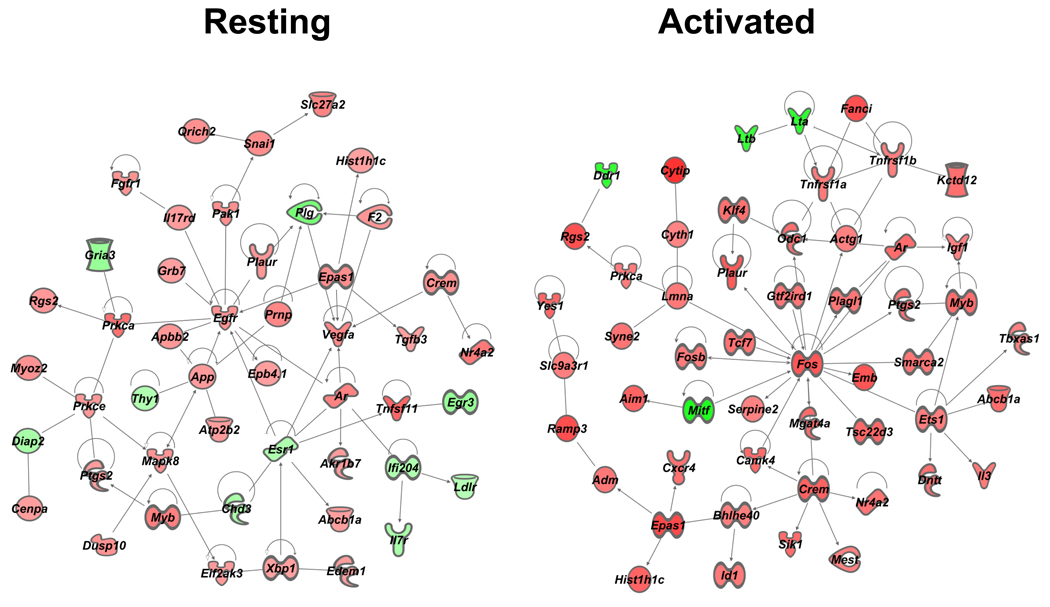
More than 40 years after the discovery of vasoactive intestinal peptide (VIP), its transcriptome in the immune system has still not been completely elucidated. In an attempt to understand the biological role of this neuropeptide in immunity, we chose CD4 T cells as a cellular system. Agilent Mouse Whole Genome microarrays were hybridized with fluorescently labeled total RNA isolated from resting CD4 T cells cultured +/-10(-7)M VIP for 5h or PMA/ionomycin activated CD4 T cells cultured +/-10(-7)M VIP for 5h. These VIP-regulated transcriptomes were analyzed by Significance Analysis of Microarrays (SAM) and Ingenuity Pathway Analysis (IPA) software to identify relevant signaling pathways modulated by VIP in the absence and presence of T cell activation. In resting CD4 T cells, VIP-modulated 368 genes, ranging from 3.49 to -4.78-fold. In the PMA/ionomycin activated CD4 T cells, 326 gene expression levels were changed by VIP, ranging from 2.94 to -1.66-fold. IPA analysis revealed that VIP exposure alters cellular function through EGFR signaling in resting CD4 T cells, and modulates immediate early genes, Fos and CREM/ICER, in activated CD4 T cells. These gene expression changes are suggested to explain at a molecular level how VIP can regulate T cell homing to the gut and induce regulatory T cell generation.


Figures

Figure 1
Figure 1
VIP receptor expression levels and phenotypic changes due to PMA/ionomycin treatment. Data is presented as means +/− SEM from three independent experiments calculated by Origin software unless otherwise noted. A. Isolation of highly enriched murine CD4 T cells. Pre- and post anti-CD4 magnetic bead (proprietary clone, Miltenyi) samples were incubated with FITC conjugated anti-mouse CD4 antibody (RM4-4) and analyzed by a FacsCalibur (Materials and Methods). Histogram plots were generated by FloJo software and percent purity is indicated. This data is representative of six independent biological experiments. B. Vpac1 is the predominant VIP-binding receptor expressed by CD4 T cells. MACS purified CD4 T cells were used to measure the relative expression levels of four known VIP receptors, Vpac1, Vpac2, Pac1 and Fprl1 by qRT-PCR. Data was normalized to Actb, and fold changes calculated by the ΔΔCt method, with Pac1 levels arbitrarily set to 1. The y-axis has a break from 30 to 3,000 as indicated by two slashes (//). C. Expected mRNA expression changes of Il2ra and Sell induced by PMA/ionomycin treatment. Purified CD4 T cells were cultured in the presence or absence of 10 ng/ml PMA and 1 µM ionomycin for 5 hours. Real-time PCR analysis was performed as described in 1B. Microarray averages were calculated from normalized pixel intensity values calculated from six (microarray) or three (qRT-PCR) independent biological experiments. Black bars represent microarray values and open bars represent qRT-PCR values. D. Expected phenotypic surface expression levels of CD25 (Il2ra) and CD62L (Sell) before and after PMA/ionomycin treatment. Purified CD4 T cells were sequentially incubated with or without PMA/ionomycin for 5 hours followed by staining with anti-CD25 (left panel) or anti-CD62 (right panel), and analyzed by an Accuri flow cytometer (Ann Arbor, MI). The red line represents cells incubated in media alone, and the black line represents cells incubated with PMA/ionomycin. These data show expected changes as there is complete shedding of CD62L with PMA/ionomycin. E. Use of biologically active VIP ligand. Chinese Hamster Ovary (CHO-K1) cells were stably transfected with human Vpac1 cDNA. Cells were incubated with varying concentrations of VIP ranging from 10−14 to 10−6 M (Materials and Methods). After fifteen minutes, cells were lysed and [cAMP]i were measured by a competitive ELISA. Curve fitting was performed in Origin graphical software.
Figure 1
Figure 1
VIP receptor expression levels and phenotypic changes due to PMA/ionomycin treatment. Data is presented as means +/− SEM from three independent experiments calculated by Origin software unless otherwise noted. A. Isolation of highly enriched murine CD4 T cells. Pre- and post anti-CD4 magnetic bead (proprietary clone, Miltenyi) samples were incubated with FITC conjugated anti-mouse CD4 antibody (RM4-4) and analyzed by a FacsCalibur (Materials and Methods). Histogram plots were generated by FloJo software and percent purity is indicated. This data is representative of six independent biological experiments. B. Vpac1 is the predominant VIP-binding receptor expressed by CD4 T cells. MACS purified CD4 T cells were used to measure the relative expression levels of four known VIP receptors, Vpac1, Vpac2, Pac1 and Fprl1 by qRT-PCR. Data was normalized to Actb, and fold changes calculated by the ΔΔCt method, with Pac1 levels arbitrarily set to 1. The y-axis has a break from 30 to 3,000 as indicated by two slashes (//). C. Expected mRNA expression changes of Il2ra and Sell induced by PMA/ionomycin treatment. Purified CD4 T cells were cultured in the presence or absence of 10 ng/ml PMA and 1 µM ionomycin for 5 hours. Real-time PCR analysis was performed as described in 1B. Microarray averages were calculated from normalized pixel intensity values calculated from six (microarray) or three (qRT-PCR) independent biological experiments. Black bars represent microarray values and open bars represent qRT-PCR values. D. Expected phenotypic surface expression levels of CD25 (Il2ra) and CD62L (Sell) before and after PMA/ionomycin treatment. Purified CD4 T cells were sequentially incubated with or without PMA/ionomycin for 5 hours followed by staining with anti-CD25 (left panel) or anti-CD62 (right panel), and analyzed by an Accuri flow cytometer (Ann Arbor, MI). The red line represents cells incubated in media alone, and the black line represents cells incubated with PMA/ionomycin. These data show expected changes as there is complete shedding of CD62L with PMA/ionomycin. E. Use of biologically active VIP ligand. Chinese Hamster Ovary (CHO-K1) cells were stably transfected with human Vpac1 cDNA. Cells were incubated with varying concentrations of VIP ranging from 10−14 to 10−6 M (Materials and Methods). After fifteen minutes, cells were lysed and [cAMP]i were measured by a competitive ELISA. Curve fitting was performed in Origin graphical software.
Figure 2
Figure 2
Identification of the early VIP transcriptome in resting and activated CD4 T cells. A. Five to ten C57BL/6J spleens were harvested for each independent experiment (n=6), and CD4 T cells were isolated by magnetic bead technology. Cells were cultured in the absence (resting) or presence of PMA/ionomycin (activated), and cultured with or without 10−7 M VIP for five hours (four groups). Total RNA was harvested from resting and activated samples, fluorescently labeled, and hybridized to Agilent Whole Genome Microarrays. These data were then analyzed by SAM and Ingenuity Pathway Analysis software (Materials and Methods). B. Venn diagrams of the number of transcripts uniquely or commonly (overlapping) modulated by VIP in resting and PMA/ionomycin activated CD4 T cells (left side) as identified by SAM analysis with a 10% FDR. The left diagram shows all VIP-modulated genes (no threshold applied), while the right panel shows the number of VIP modulated genes after a ≥ −/+ 1.5 fold cutoff. C. Gene names that are commonly regulated by VIP (after a ≥ −/+ 1.5 fold cutoff) with fold change values indicated. D. Pie charts showing the percentage changes of genes in fourteen functional categories identified by IPA for the resting and activated datasets.
Figure 2
Figure 2
Identification of the early VIP transcriptome in resting and activated CD4 T cells. A. Five to ten C57BL/6J spleens were harvested for each independent experiment (n=6), and CD4 T cells were isolated by magnetic bead technology. Cells were cultured in the absence (resting) or presence of PMA/ionomycin (activated), and cultured with or without 10−7 M VIP for five hours (four groups). Total RNA was harvested from resting and activated samples, fluorescently labeled, and hybridized to Agilent Whole Genome Microarrays. These data were then analyzed by SAM and Ingenuity Pathway Analysis software (Materials and Methods). B. Venn diagrams of the number of transcripts uniquely or commonly (overlapping) modulated by VIP in resting and PMA/ionomycin activated CD4 T cells (left side) as identified by SAM analysis with a 10% FDR. The left diagram shows all VIP-modulated genes (no threshold applied), while the right panel shows the number of VIP modulated genes after a ≥ −/+ 1.5 fold cutoff. C. Gene names that are commonly regulated by VIP (after a ≥ −/+ 1.5 fold cutoff) with fold change values indicated. D. Pie charts showing the percentage changes of genes in fourteen functional categories identified by IPA for the resting and activated datasets.
Figure 3
Figure 3
qPCR corroboration of VIP modulated gene targets identified by microarray analysis. RT-PCR was utilized to measure transcript level changes in response to VIP treatment. Gene of interest values were normalized to Actb and data represents means +/− SEM calculated by the ΔΔCt method from six (microarray) or three (qPCR) independent experiments as indicated using A. resting, and B. activated samples. Black bars represent microarray values and open bars represent qRT-PCR values.
Figure 3
Figure 3
qPCR corroboration of VIP modulated gene targets identified by microarray analysis. RT-PCR was utilized to measure transcript level changes in response to VIP treatment. Gene of interest values were normalized to Actb and data represents means +/− SEM calculated by the ΔΔCt method from six (microarray) or three (qPCR) independent experiments as indicated using A. resting, and B. activated samples. Black bars represent microarray values and open bars represent qRT-PCR values.
Figure 4
Figure 4
IPA generated networks of VIP modulated genes and their corresponding networks in resting CD4 T cells. No user-defined cutoffs for expression values were used for network generation. Networks scores were generated by Ingenuity’s Network Generation Algorithm, and were assigned the following scores, A. 36, B. 31 and C. 31, respectively. Open symbols are intermediate molecules, “non-focus genes,” placed in the network by the Ingenuity software, but are not regulated by VIP. “Focus genes” are regulated by VIP and are denoted by red symbols for upregulated genes, and green symbols indicate downregulated genes. Symbols representing functional categories of the molecules are listed in the legend.
Figure 5
Figure 5
IPA generated networks of VIP modulated genes and their corresponding networks in activated CD4 T cells. IPA analysis was conducted as described in Fig. 4. Network scores were A. 39, B. 35 and C. 32, respectively. The functional classifications denoted by the symbols are found in the legend for Figure 4.
Figure 6
Figure 6
Identification of the direct VIP interactome for resting and activated datasets. In IPA software, the identical datasets used in Figure 4 and 5 for resting or activated samples, were selected to Build a network using the Connect function in IPA for A. resting and B. activated datasets. The symbol legend is located in Figure 4.

Similar articles

Cited by

References

    1. Abad C, Juarranz Y, Martinez C, Arranz A, Rosignoli F, Garcia-Gomez M, Leceta J, Gomariz RP. cDNA array analysis of cytokines, chemokines, and receptors involved in the development of TNBS-induced colitis: homeostatic role of VIP. Inflamm Bowel Dis. 2005;11:674–684. - PubMed
    1. Abad C, Martinez C, Juarranz MG, Arranz A, Leceta J, Delgado M, Gomariz RP. Therapeutic effects of vasoactive intestinal peptide in the trinitrobenzene sulfonic acid mice model of Crohn's disease. Gastroenterology. 2003;124:961–971. - PubMed
    1. Altman A, Mally MI, Isakov N. Phorbol ester synergizes with Ca2+ ionophore in activation of protein kinase C (PKC)alpha and PKC beta isoenzymes in human T cells and in induction of related cellular functions. Immunology. 1992;76:465–471. - PMC - PubMed
    1. Arranz A, Gutierrez-Canas I, Carrion M, Juarranz Y, Pablos JL, Martinez C, Gomariz RP. VIP reverses the expression profiling of TLR4-stimulated signaling pathway in rheumatoid arthritis synovial fibroblasts. Mol Immunol. 2008;45:3065–3073. - PubMed
    1. Ben-Horin S, Chowers Y. Neuroimmunology of the gut: physiology, pathology, and pharmacology. Curr Opin Pharmacol. 2008;8:490–495. - PubMed

Publication types

MeSH terms

Substances