. 2010 Mar 26;285(13):9636-9641.
doi: 10.1074/jbc.M109.062588. Epub 2010 Jan 29.

G9a and Glp methylate lysine 373 in the tumor suppressor p53

Affiliations

G9a and Glp methylate lysine 373 in the tumor suppressor p53

Jing Huang et al. J Biol Chem. .

Erratum in

  • J Biol Chem. 2010 Jun 4;285(23):18122. Pérez-Burgos, Laura [added]

Abstract

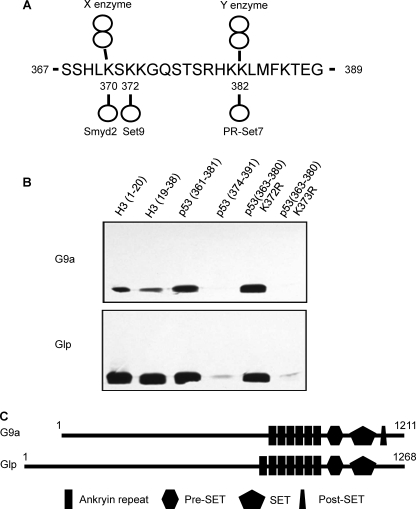
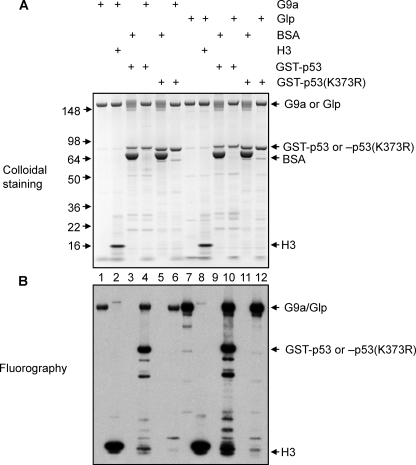
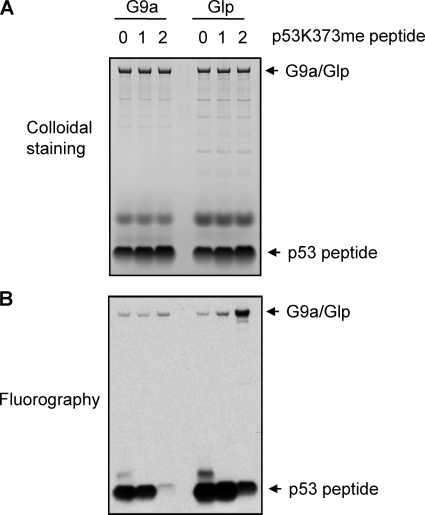
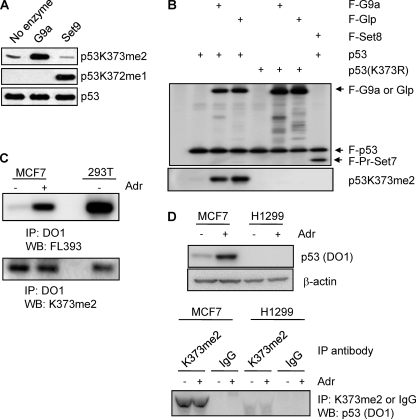
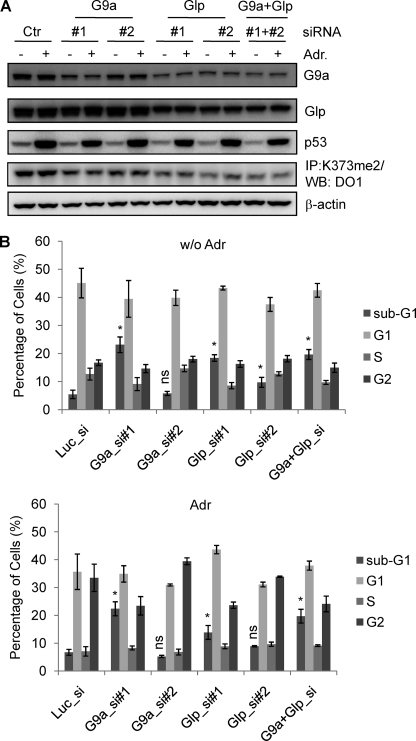
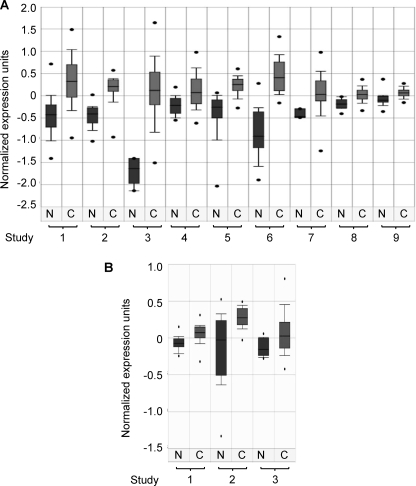
The tumor suppressor p53 is regulated by numerous post-translational modifications. Lysine methylation has recently emerged as a key post-translational modification that alters the activity of p53. Here, we describe a novel lysine methylation site in p53 that is carried out by two homologous histone methyltransferases, G9a and Glp. G9a and Glp specifically methylate p53 at Lys(373), resulting mainly in dimethylation. During DNA damage, the overall level of p53 modified at Lys(373)me2 does not increase, despite the dramatic increase in total p53, indicating that Lys(373)me2 correlates with inactive p53. Further, reduction of G9a and/or Glp levels leads to a larger population of apoptotic cells. Examination of the Oncomine data base shows that G9a and Glp are overexpressed in various cancers compared with corresponding normal tissues, suggesting that they are putative oncogenes. These data reveal a new methylation site within p53 mediated by the methylases G9a and Glp and indicate that G9a is a potential inhibitory target for cancer treatment.


Figures

FIGURE 1.
FIGURE 1.
G9 and Glp methylate p53 peptides at Lys373. A, summary of known p53 methylation sites. X and Y indicate that the enzymes for these dimethyl sites are not identified. The methylation status (mono- or di-) has been validated by Western blotting and mass spectrometry. B, fluorography of histone and p53 peptide methylation by G9a and Glp enzymes. C, schematic showing domain structure of human G9a and Glp enzymes.
FIGURE 2.
FIGURE 2.
G9a and Glp methylate full-length p53 at Lys373. A, colloidal staining of in vitro methylation of p53 by G9a or Glp. Bovine serum albumin (BSA) serves as a negative control for enzymes, and H3 serves as a positive control for substrates. 2 μg of substrate and 1 μg of enzyme were used for each reaction. The components in each reaction are indicated. B, fluorography of in vitro methylation of p53 by G9a or Glp. A and B were identical volume aliquots from the same reaction.
FIGURE 3.
FIGURE 3.
p53Lys373 methylation status by G9a and Glp. A, colloidal staining of in vitro methylation by G9a and Glp of peptides representing p53 (363–380) incorporating Lys373me0, me1, and me2. 1 μg of substrate and 1 μg of enzyme were used for each reaction. The components for each reaction are indicated. B, fluorography of in vitro methylation of p53 peptides by G9a or Glp. A and B were identical volume aliquots from the same reaction.
FIGURE 4.
FIGURE 4.
G9a and Glp methylate p53 in mammalian cells. A, testing of polyclonal antibody recognizing p53Lys373me2. Full-length p53 was unmethylated or methylated by either recombinant G9a or Set9 in vitro. Methylation products were subjected to Western blot analysis with antibodies specific to p53Lys373me2, p53Lys372me1, and total p53. B, Western blot analysis of 293T cells transfected with vectors as indicated using FLAG antibody (upper panel) and p53Lys373me2 antibody (lower panel). F, FLAG-tagged; K373R, lysine to arginine substitute at Lys373. C, Western blot analysis of MCF7 cells untreated or treated with adriamycin for 8 h. 293T cell lysate was used as a control. Immunoprecipitates (IP) using DO1 were subjected to Western blot (WB) analysis using rabbit polyclonal antibody, FL393 (upper panel), and Lys373me2 antibody (lower panel). D, upper panels, Western blot analysis of MCF7 and H1299 cells untreated or treated with adriamycin (Adr) for 8 h using p53 (DO1) and β-actin antibodies. Lower panels, same amount of cell lysates from MCF7 or H1299 was immunoprecipitated with p53Lys373me2 or IgG (negative control) antibody followed by Western blot analysis using p53 (DO1) antibody.
FIGURE 5.
FIGURE 5.
G9a and Glp knockdown increases apoptosis in MCF7 cells. A, Western blot (WB) analysis with MCF7 cell lysates mock-transfected or transfected with G9a and/or Glp siRNAs followed by adriamycin (Adr) treatment. Antibodies were G9a, Glp, p53, and β-actin as indicated on the right side. To detect Lys373me2 signal, same amount of cell lysates were immunoprecipitated (IP) with p53Lys373me2 antibody followed by Western blot analysis using p53 (DO1) antibody. B, flow cytometry analysis of MCF7 cells transfected with luciferase (control), G9a (G9a_si1 and si2), Glp (Glp_si1 and si2), and both G9 and Glp siRNAs followed by 36-h adriamycin treatment. Propidium iodide was used to stain the DNA for flow cytometry. Shown are the average percentage of cells from three or four independent repeats, and only the statistical analyses of sub-G1 are shown; *, p < 0.05 (compared with Luc_si); ns, not significant. Error bars, S.E.
FIGURE 6.
FIGURE 6.
G9 and Glp are up-regulated in many types of cancer. A, boxplot of G9a expression in normal and cancerous tissues. N, normal tissue; C, cancerous tissue. The listed nine independent studies include: 1, nontumor liver versus hepatocellular carcinoma, p = 6.3e-24; 2, normal bladder versus superficial transitional cell carcinoma and invasive transitional cell carcinoma, p = 6.7e-8; 3, normal bone marrow versus B cell acute lymphoblastic leukemia, p = 3.9e-7; 4, adjacent normal colon mucosa versus primary colon carcinoma, p = 2e-6; 5, normal skin and benign nevus versus cutaneous melanoma, p = 4e-6; 6, normal adjacent prostate, normal adult prostate, normal pubertal prostate versus prostate carcinoma, p = 7e-6; 7, normal ovary versus ovarian serous adenocarcinoma, p = 1e-5; 8, normal lung versus lung adenocarcinoma, p = 6.6e-5; 9, normal B cells versus B cell chronic lymphocytic leukemia, p = 7.5e-5. B, boxplot of Glp expression in normal tissues and cancerous tissues. The listed three independent studies include: 1, normal brain versus astrocytoma, p = 1.4E-4; 2, normal bone marrow versus smoldering multiple myeloma, p = 5.1E-4; 3, normal versus head and neck cancer, p = 6.1E-4.

Similar articles

Cited by

References

    1. Bode A. M., Dong Z. (2004) Nat. Rev. Cancer 4, 793–805 - PubMed
    1. Prives C., Manley J. L. (2001) Cell 107, 815–818 - PubMed
    1. Huang J., Berger S. L. (2008) Curr. Opin. Genet. Dev. 18, 152–158 - PubMed
    1. Schotta G., Lachner M., Sarma Lys., Ebert A., Sengupta R., Reuter G., Reinberg D., Jenuwein T. (2004) Genes Dev. 18, 1251–1262 - PMC - PubMed
    1. Huang J., Perez-Burgos L., Placek B. J., Sengupta R., Richter M., Dorsey J. A., Lysubicek S., Opravil S., Jenuwein T., Berger S. L. (2006) Nature 444, 629–632 - PubMed

Publication types

MeSH terms