. 2010 Mar 1;184(5):2458-67.
doi: 10.4049/jimmunol.0902407. Epub 2010 Jan 29.

Control of alpha4beta7 integrin expression and CD4 T cell homing by the beta1 integrin subunit

Affiliations

Control of alpha4beta7 integrin expression and CD4 T cell homing by the beta1 integrin subunit

Christopher C DeNucci et al. J Immunol. .

Abstract

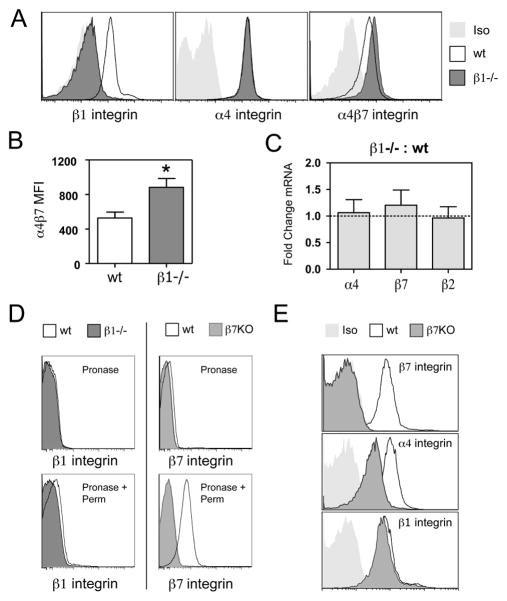
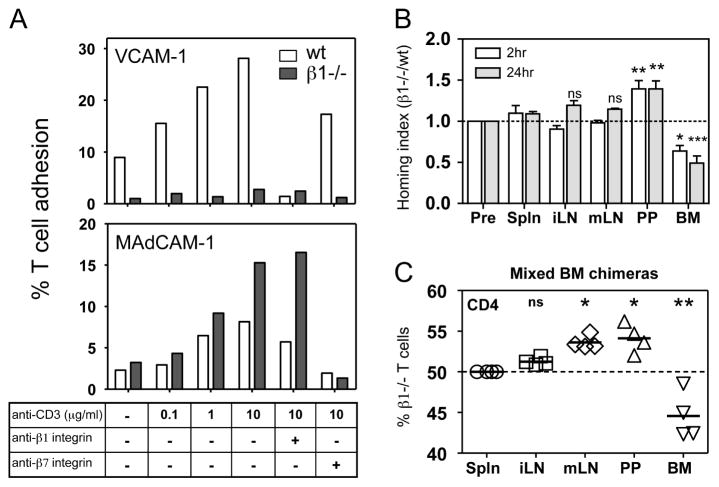
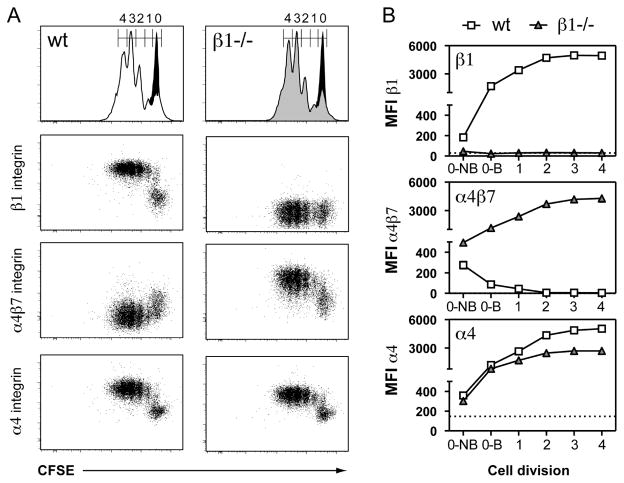
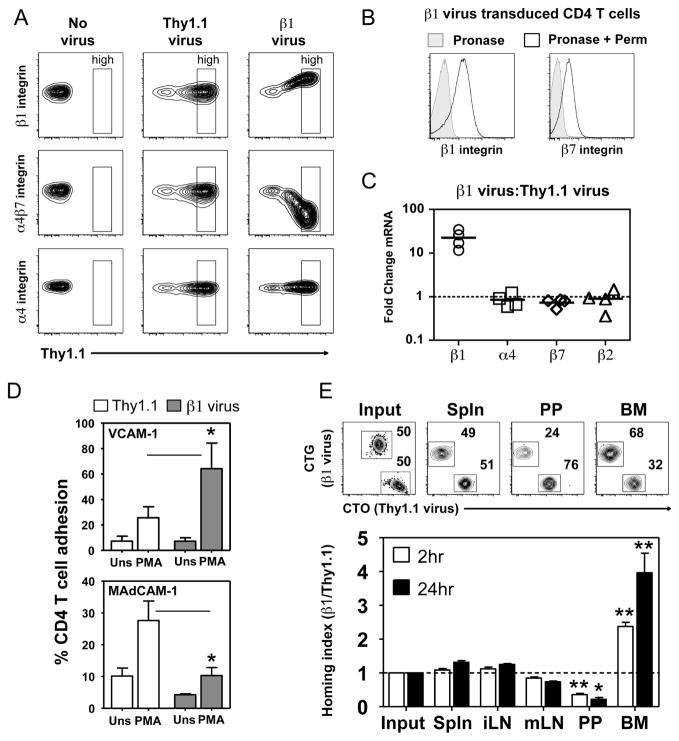
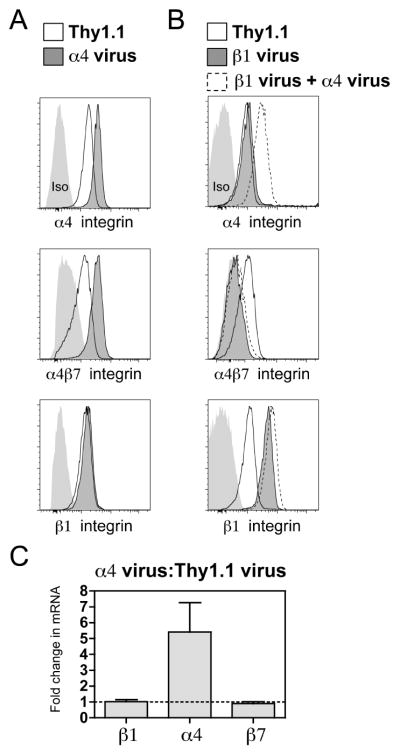
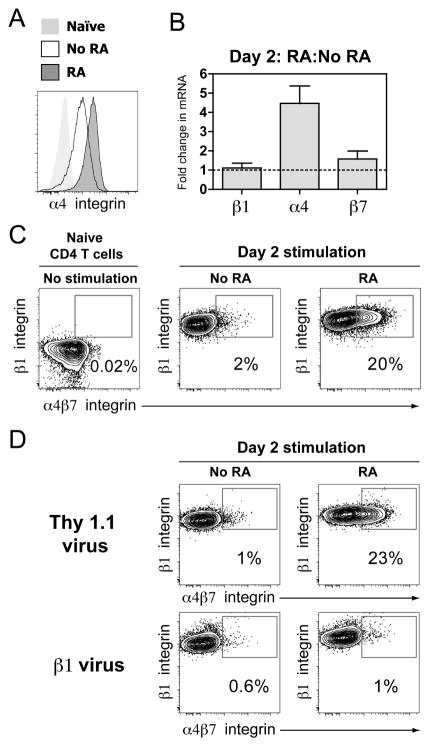
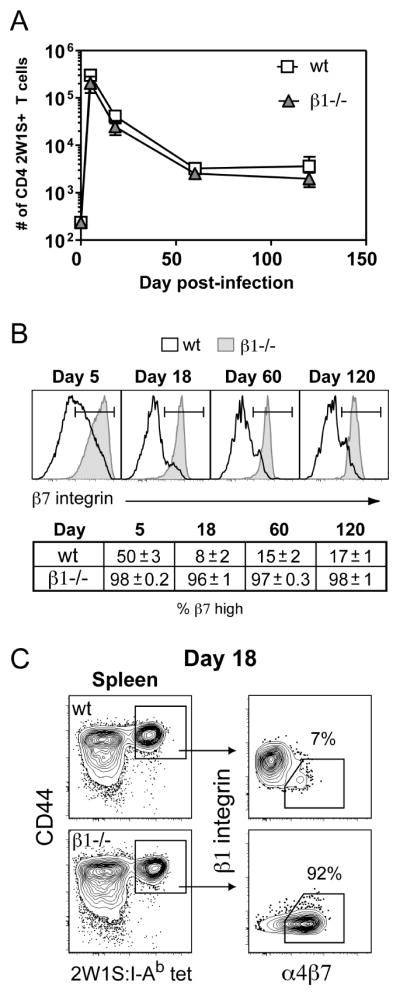
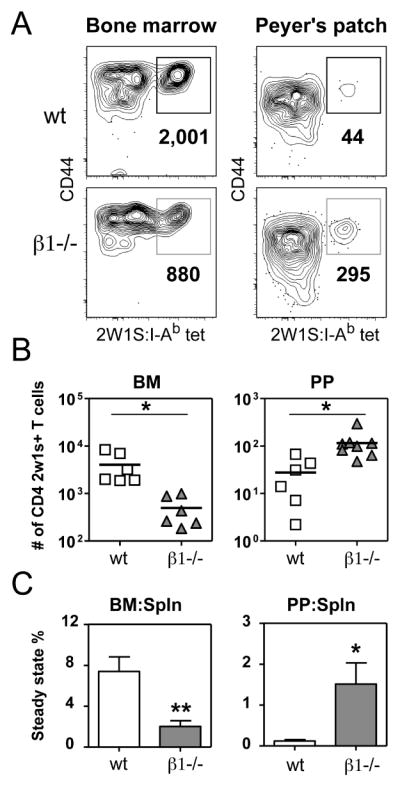
The alpha4beta7 integrin promotes homing of T cells to intestinal sites. The alpha4 integrin subunit that pairs with beta7 integrin can also pair with beta1 integrin. In this paper, we show that the preferential pairing of beta1 integrin with alpha4 integrin regulates the expression of alpha4beta7 on T cells. In the absence of beta1 integrin, naive mouse CD4 T cells have increased alpha4beta7 expression, resulting in increased adhesion to mucosal addressin cell adhesion molecule-1 and enhanced homing to Peyer's patches (PP). In a reciprocal manner, overexpression of beta1 integrin causes the loss of alpha4beta7 expression and decreased homing to PP. A similar upregulation of beta1 integrin and suppression of alpha4beta7 expression occurs rapidly after CD4 T cell activation. beta1 integrin thus dominates beta7 integrin for alpha4 integrin pairing, thereby controlling the abundance of unpaired alpha4 integrin. Increasing the abundance of alpha4 integrin relative to beta1 integrin is critical to retinoic acid-mediated expression of alpha4beta7 integrin during T cell activation. In the absence of beta1 integrin, endogenous Ag-specific CD4 T cells uniformly express high levels of alpha4beta7 after Listeria monocytogenes infection. The resulting beta1-deficient early memory T cells have decreased localization to the bone marrow and enhanced localization to PP after infection. Thus, the preferential association of beta1 integrin with alpha4 integrin suppresses alpha4beta7 integrin expression and regulates the localization of memory CD4 T cells.


Figures

Figure 1
Figure 1. Loss of β1 integrin on mouse CD4 T cells results in increased surface expression of α4β7
(A) Representative FACS staining of inguinal lymph node cells from β1wt/wtCD4-Cre+ (wt) and β1fl/flCD4-Cre+ (β1−/−) mice gated on Thy1.2 and CD4 double positive cells using anti-β1 integrin, anti-α4 integrin, and anti-α4β7 integrin antibodies. Light gray histograms represent appropriate isotype control (Iso) staining. (B) Median fluorescence intensity of α4β7 expression on CD4 T cells from wt or β1−/− lymph nodes. Bars show mean with s.e.m. (n=5 separate mice;*p=0.0009, two-tailed paired t-test). (C) Comparison of relative abundance of α4, β7 and β2 integrin mRNA levels between β1−/− and wt CD4 T cells. Real-time RT-PCR data is presented as fold change between groups based on the comparative CT method. Bars represent mean with s.e.m. (n=3). (D) Intracellular β1 and β7 integrin staining on purified, wt CD4 T cells. The samples in the top panel were treated with pronase (to strip cell surface proteins), fixed and stained for β1 and β7 integrin as a control for the effectiveness of pronase treatment. Samples in the bottom panel were permeabilized after pronase treatment and stained again to identify intracellular stores of integrin. β1−/− and β7−/− (β7KO) CD4 T cells were used as a control for non-specific staining. (E) Representative FACS histograms of lymph node cells from wild-type and β7−/− (β7KO) mice.
Figure 2
Figure 2. T cells lacking β1 integrin have altered adhesion to α4 integrin ligands and trafficking to the bone marrow and Peyer’s patches
(A) Adhesion of wild-type (wt) and β1−/−purified T cells to plate bound VCAM-1 or MAdCAM-1 following stimulation with soluble anti-CD3ε (2C11) antibody. Integrin blocking antibodies were used to demonstrate the specificity of T cell-ligand interactions. The bars represent mean values from 4 replicates in 1 representative experiment of 3–4. (B) β1wt/wtCD4-Cre+ (wt) and β1fl/flCD4-Cre+ (β1−/−) CD4 T cells were differentially labeled, equally mixed and transferred into recipient mice. Recipient organs were harvested at 2 and 24 hours post-transfer and the ratio of CD4 transferred cells recovered was normalized to the transfer ratio from the mixed sample prior to injection (Input). Values greater than 1 indicate that β1−/− CD4 T cells were present in higher numbers than wt. Bars represent mean with s.e.m. (n = 3–5 mice from 2 independent experiments) (C) Percentage of β1−/−CD4+CD44low T cells recovered from the lymphoid organs of wt:β1−/− mixed chimeric mice. All samples are normalized to the percentage of splenic β1−/− CD4+CD44low T cells, which was set to 50%. The values represent altered steady state distribution of β1−/− CD4+CD44low T cells compared to the percentage recovered in the spleen. All experimental groups were compared against input or normalized spleen, ns > 0.05, * p = 0.01–0.05 and ** p = 0.001–0.01, *** p > 0.001, 1-way ANOVA followed by Tukey’s multiple comparison test.
Figure 3
Figure 3. β1 integrin-deficient T cells express high levels of α4β7 following stimulation in vitro
(A) Purified naïve β1wt/wtCD4-Cre+ (wt) and β1fl/flCD4-Cre+ (β1−/−) CD4 T cells labeled with CFSE were stimulated for three days with plate bound anti-CD3/CD28 antibodies. Histograms show CFSE dilution profiles of wt (white) and β1−/− (gray) CD4 T cells overlaid on unstimulated control CD4 T cells (black). Stimulated cells were additionally stained for integrin expression. (B) Median florescence intensities (MFI) of wt and β1−/− CD4 T cells based on CFSE division peaks from one representative experiment of three. Gate 0 (undivided) is separated into non-blasting (0-NB) and blasting (0-B) CD4 T cells (Fig. S4B). Dotted lines represent isotype control staining on stimulated samples. The isotype control for α4β7 overlays the x-axis.
Figure 4
Figure 4. High expression of β1 integrin results in loss of α4β7 expression and function
(A) Integrin staining on hCAR+ CD4 T cells transduced with no virus, a Thy1.1 control virus, or virus expressing Thy1.1 and β1 integrin (β1 virus). Gates define the Thy1.1 high population. (B) Intracellular β1 and β7 integrin staining on purified CD4 T cells transduced with β1 virus for two days. Cells treated with pronase alone then stained (Pronase) are compared to cells that underwent additional permeabilization and staining to identify intracellular stores of integrin (Pronase + Perm). (C) Comparison of relative abundance of β1, α4, β7 and β2 integrin mRNA levels between β1 virus and Thy1.1 control transduced CD4 T cells. Real-time RT-PCR data presented as fold change between groups based on the comparative CT method. Bars represent the mean. (D) Adhesion of Thy1.1 high expressing Thy1.1 control or β1 virus transduced CD4 T cells to plate bound VCAM-1 or MAdCAM-1 following stimulation with PMA. Bars represent mean values with s.e.m. (n=4 independent experiments;* p < 0.05, two-tailed paired t-test). (E) Co-homing of adenovirus transduced CD4 T cells labeled with Cell Tracker Orange (CTO) (Thy1.1 virus) or Cell Tracker Green (CTG) (β1 virus). Representative FACS dot plots show the percentage of Thy1.1 control and β1 virus transduced Thy1.1 high CD4+ cells recovered from each sample at two hours post-transfer. The ratio of Thy1.1 high CD4+ transferred cells recovered was normalized to the ratio of Thy1.1 high CD4 T cells transferred (Input). Values greater than 1 indicate that β1 virus transduced CD4 T cells were present in higher numbers than Thy1.1 virus control. Bars represent mean with s.e.m. (n = 4 mice in 2 independent experiments). Experimental groups were compared against input, * p = 0.01–0.05, ** p < 0.001, 1-way ANOVA followed by Tukey’s multiple comparison test.
Figure 5
Figure 5. Abundance of α4 integrin controls α4β7 integrin expression
(A) Representative FACS histograms showing α4, α4β7, and β1 integrin staining on Thy1.1 control and α4 virus transduced CD4 T cells. Light gray histograms represent appropriate isotype (Iso) control staining. (B) Representative FACS histograms showing α4, α4β7, and β1 integrin staining on Thy1.1 control, β1 virus and β1 + α4 virus co-transduced CD4 T cells. Light gray histograms represent appropriate isotype (Iso) control staining. (C) Comparison of relative β1, α4 and β7 integrin levels between α4 virus and Thy1.1 control transduced CD4 T cells. Real-time RT-PCR data presented as fold change between groups based on the comparative CT method. Bars represent the mean with s.e.m. (n=3)
Figure 6
Figure 6. Retinoic acid enhances α4β7 expression by increasing α4 integrin abundance
(A) Representative histogram of α4 integrin staining on naïve CD4 T cells or CD4 T cells stimulated (anti-CD3/CD28) with or without 1000 nM retinoic acid (RA) for two days. (B) Comparison of relative abundance of β1, α4, and β7 integrin mRNA levels between purified CD4 T cells stimulated with or without RA for two days. Real-time RT-PCR data presented as fold change between groups based on the comparative CT method. Bars represent the mean with s.e.m. (n=3) (C) Representative dot plots showing β1 integrin vs. α4β7 integrin expression on naïve CD4 T cells or CD4 T cells stimulated without or with RA for two days. The percentage of cells in the α4β7-high, β1 integrin high gate is displayed in the plots. (D) Representative dot plots showing β1 integrin vs. α4β7 integrin on Thy1.1 control and β1 virus transduced CD4 T cells stimulated without or with RA for two days. The percentage of cells in the α4β7 high, β1 integrin high gate is displayed in the plots.
Figure 7
Figure 7. Polyclonal endogenous β1−/− CD4 T cells in the spleen have enhanced α4β7 expression following intravenous infection
(A) pMHC-II tetramer enrichment was used to quantify the number of endogenous 2W1S-specific CD4 T cells in control β1wt/wtCD4-Cre+ (wt) and β1fl/flCD4-Cre+ (β1−/−) mouse spleens following i.v. infection with ALm-2W1S. Time 0 represents the number of 2W1S-specific recovered from naïve wild-type or β1−/− mice. Symbols represent mean with s.e.m. (n = 4–11 mice/time point except wt day 120, n = 2). (B) Representative histograms of β7 integrin expression on splenic 2W1S-specific CD4 T cells from wt and β1−/− mice. The table indicates mean percentage (+/− s.e.m.) of β7-high splenic 2W1S-specific CD4 T cells (n=2–5 mice). (C) Representative 2W1S:I-Ab tetramer staining of splenic CD4+ T cells from wt and β1−/− mice 18 days post-infection. β1 integrin vs. α4β7 integrin expression is shown on the gated CD44high 2W1S:I-Ab tetramer+ cells.
Figure 8
Figure 8. β1 integrin-deficient early memory CD4 T cells have enhanced localization to the Peyer’s patches and reduced maintenance in the bone marrow
(A) Representative 2W1S:I-Ab tetramer staining of CD4+ T cells isolated from BM and PP 18 days following i.v. infection with ALm-2W1S. The bold numbers below the gate are the total calculated 2W1S-specific CD4 T cells recovered from each sample. (B) Individual replicates of 2W1S-specific CD4 T cell numbers recovered from the BM and PP 18 days post-infection. Line represents mean value (* p < 0.02, two-tailed unpaired t-test). (C) The steady state percentage represents the number of 2W1S-specific CD4 T cells recovered in the BM or PP compared to the spleen of the same mouse. Bars represent mean with s.e.m. (n = 3–7 mice, * p < 0.04, ** p < 0.006, two-tailed unpaired t-test).

Similar articles

Cited by

References

    1. Hynes RO. Integrins: bidirectional, allosteric signaling machines. Cell. 2002;110:673–687. - PubMed
    1. von Andrian UH, Mackay CR. T-cell function and migration. Two sides of the same coin. N Engl J Med. 2000;343:1020–1034. - PubMed
    1. DeNucci CC, Mitchell JS, Shimizu Y. Integrin function in T cell homing and non-lymphoid sites: getting there and staying there. Crit Rev Immunol. 2009;29:87–109. - PMC - PubMed
    1. Schweighoffer T, Tanaka Y, Tidswell M, Erle DJ, Horgan KJ, Luce GE, Lazarovits AI, Buck D, Shaw S. Selective expression of integrin α4β7 on a subset of human CD4+ memory T cells with hallmarks of gut-trophism. J Immunol. 1993;151:717–729. - PubMed
    1. Masopust D, Vezys V, Wherry EJ, Barber DL, Ahmed R. Cutting edge: gut microenvironment promotes differentiation of a unique memory CD8 T cell population. J Immunol. 2006;176:2079–2083. - PubMed

Publication types

MeSH terms